Figure 14
Download original image
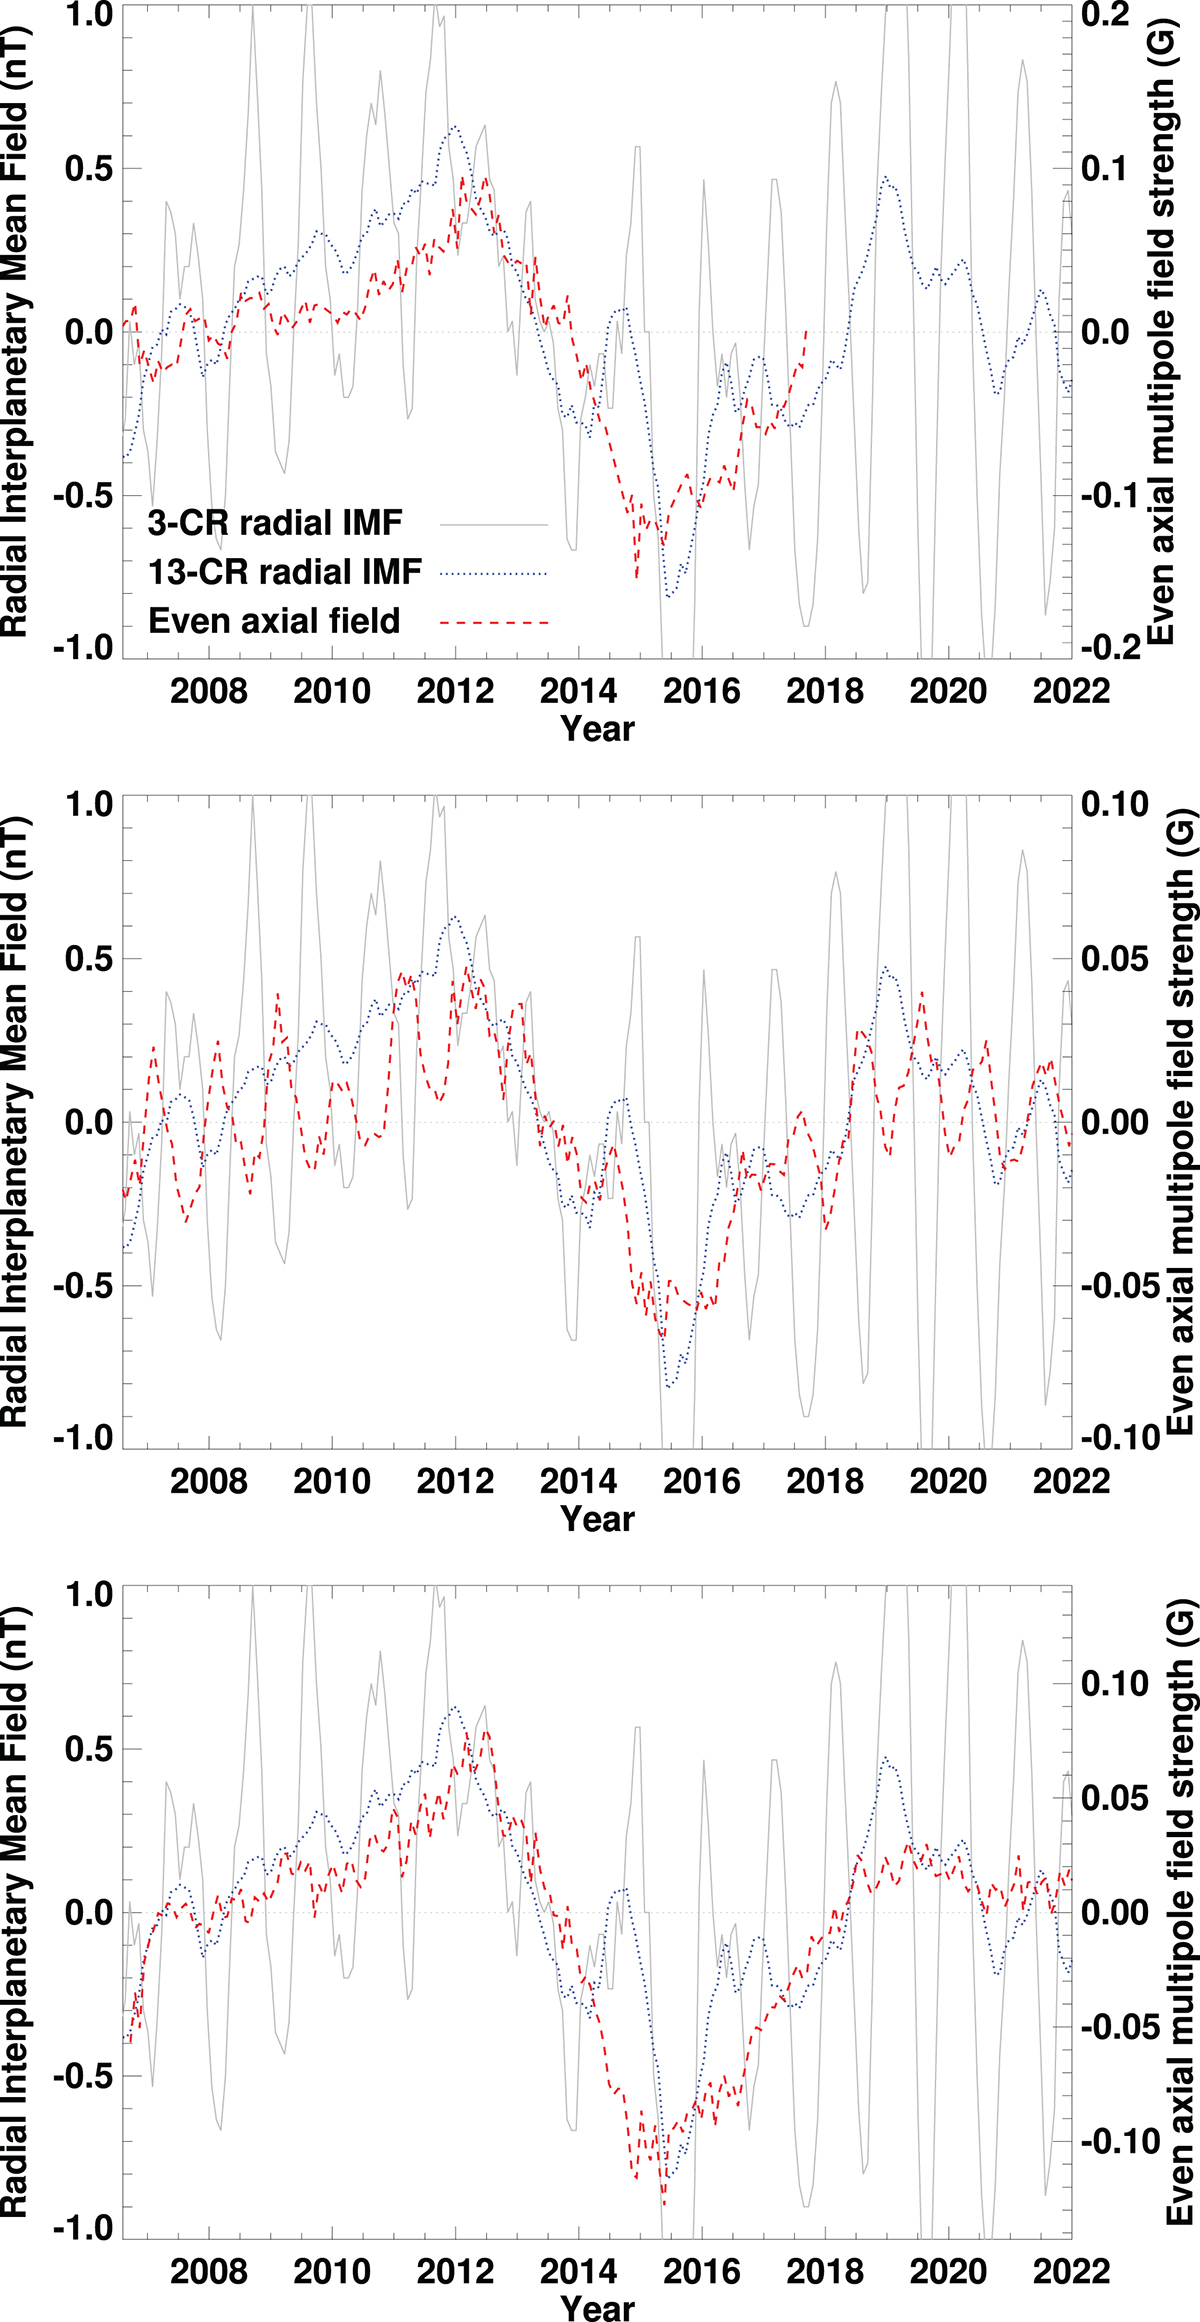
The radial IMF from the OMNI database is plotted against time over 2005–2022, with 3-CR (gray solid curves), and 13-CR (blue dotted curves) smoothing (blue dotted lines), with the signed axial even multipole strengths overplotted (red dashed lines, right axis labels), for KPVT and SOLIS (top), Wilcox (middle) and GONG (bottom) data. The resemblance between the axial quadrupole curves and the radial IMF curve during the cycle 24 polar reversal is clear in each plot, and is much greater than usual during this time.
Current usage metrics show cumulative count of Article Views (full-text article views including HTML views, PDF and ePub downloads, according to the available data) and Abstracts Views on Vision4Press platform.
Data correspond to usage on the plateform after 2015. The current usage metrics is available 48-96 hours after online publication and is updated daily on week days.
Initial download of the metrics may take a while.