Figure 2
Download original image
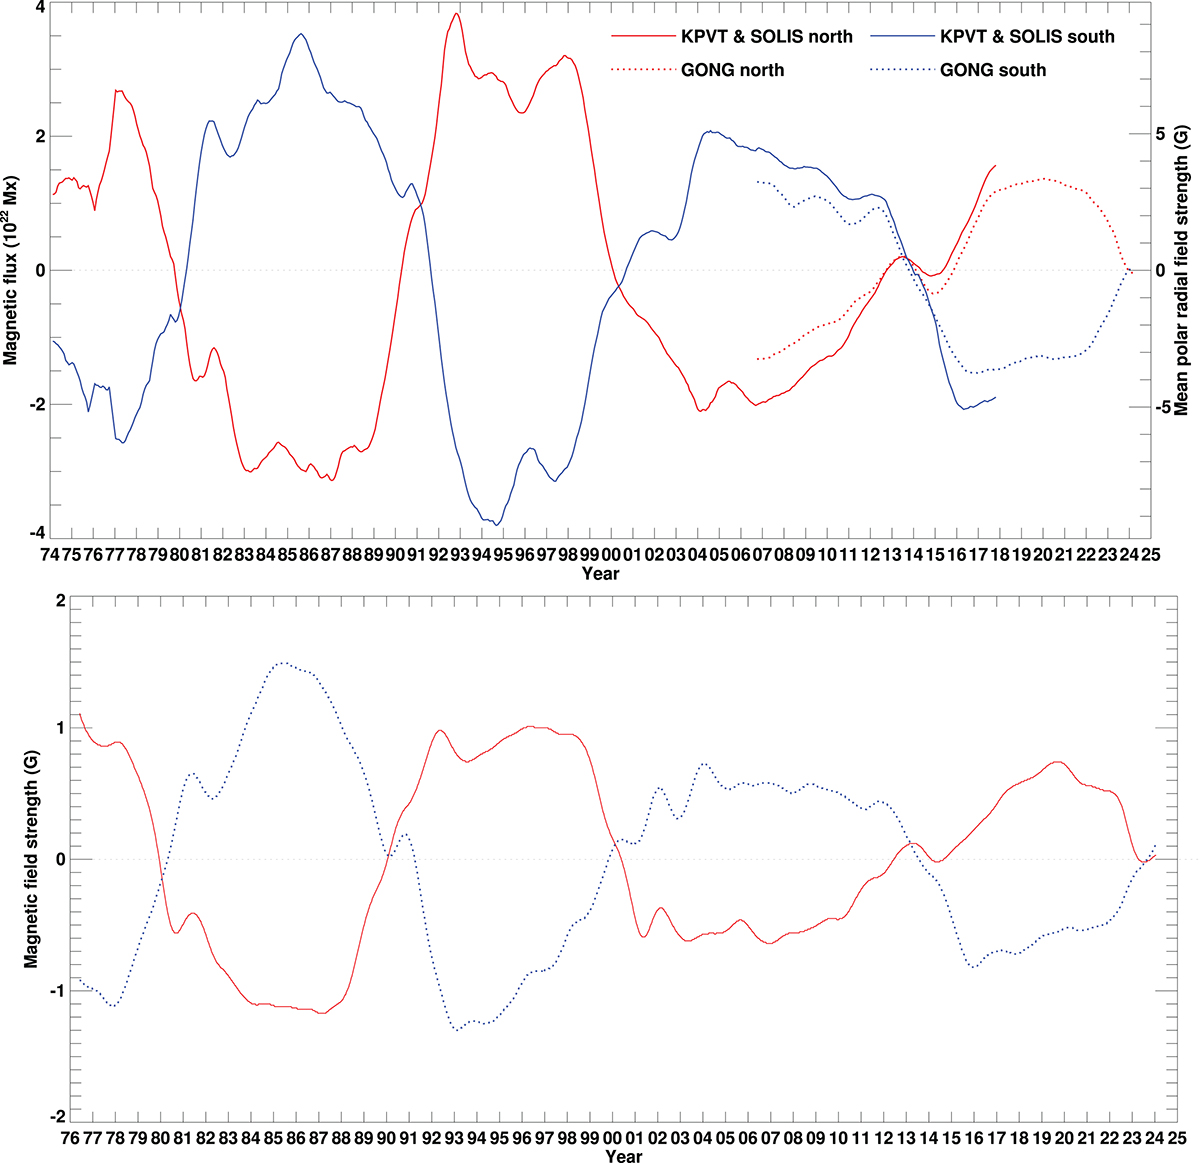
In the top panel, adapted and updated from Petrie (2023), the polar magnetic flux is plotted against time for KPVT and SOLIS (solid lines), and GONG (dotted lines) data. Here the polar region is defined as poleward of ±60°, and the radial flux is plotted, with the axis to the right indicating the mean polar radial field strength. In the bottom panel, updated from Petrie (2013), the mean LOS field is plotted for Wilcox data.
Current usage metrics show cumulative count of Article Views (full-text article views including HTML views, PDF and ePub downloads, according to the available data) and Abstracts Views on Vision4Press platform.
Data correspond to usage on the plateform after 2015. The current usage metrics is available 48-96 hours after online publication and is updated daily on week days.
Initial download of the metrics may take a while.