Figure 6

Download original image
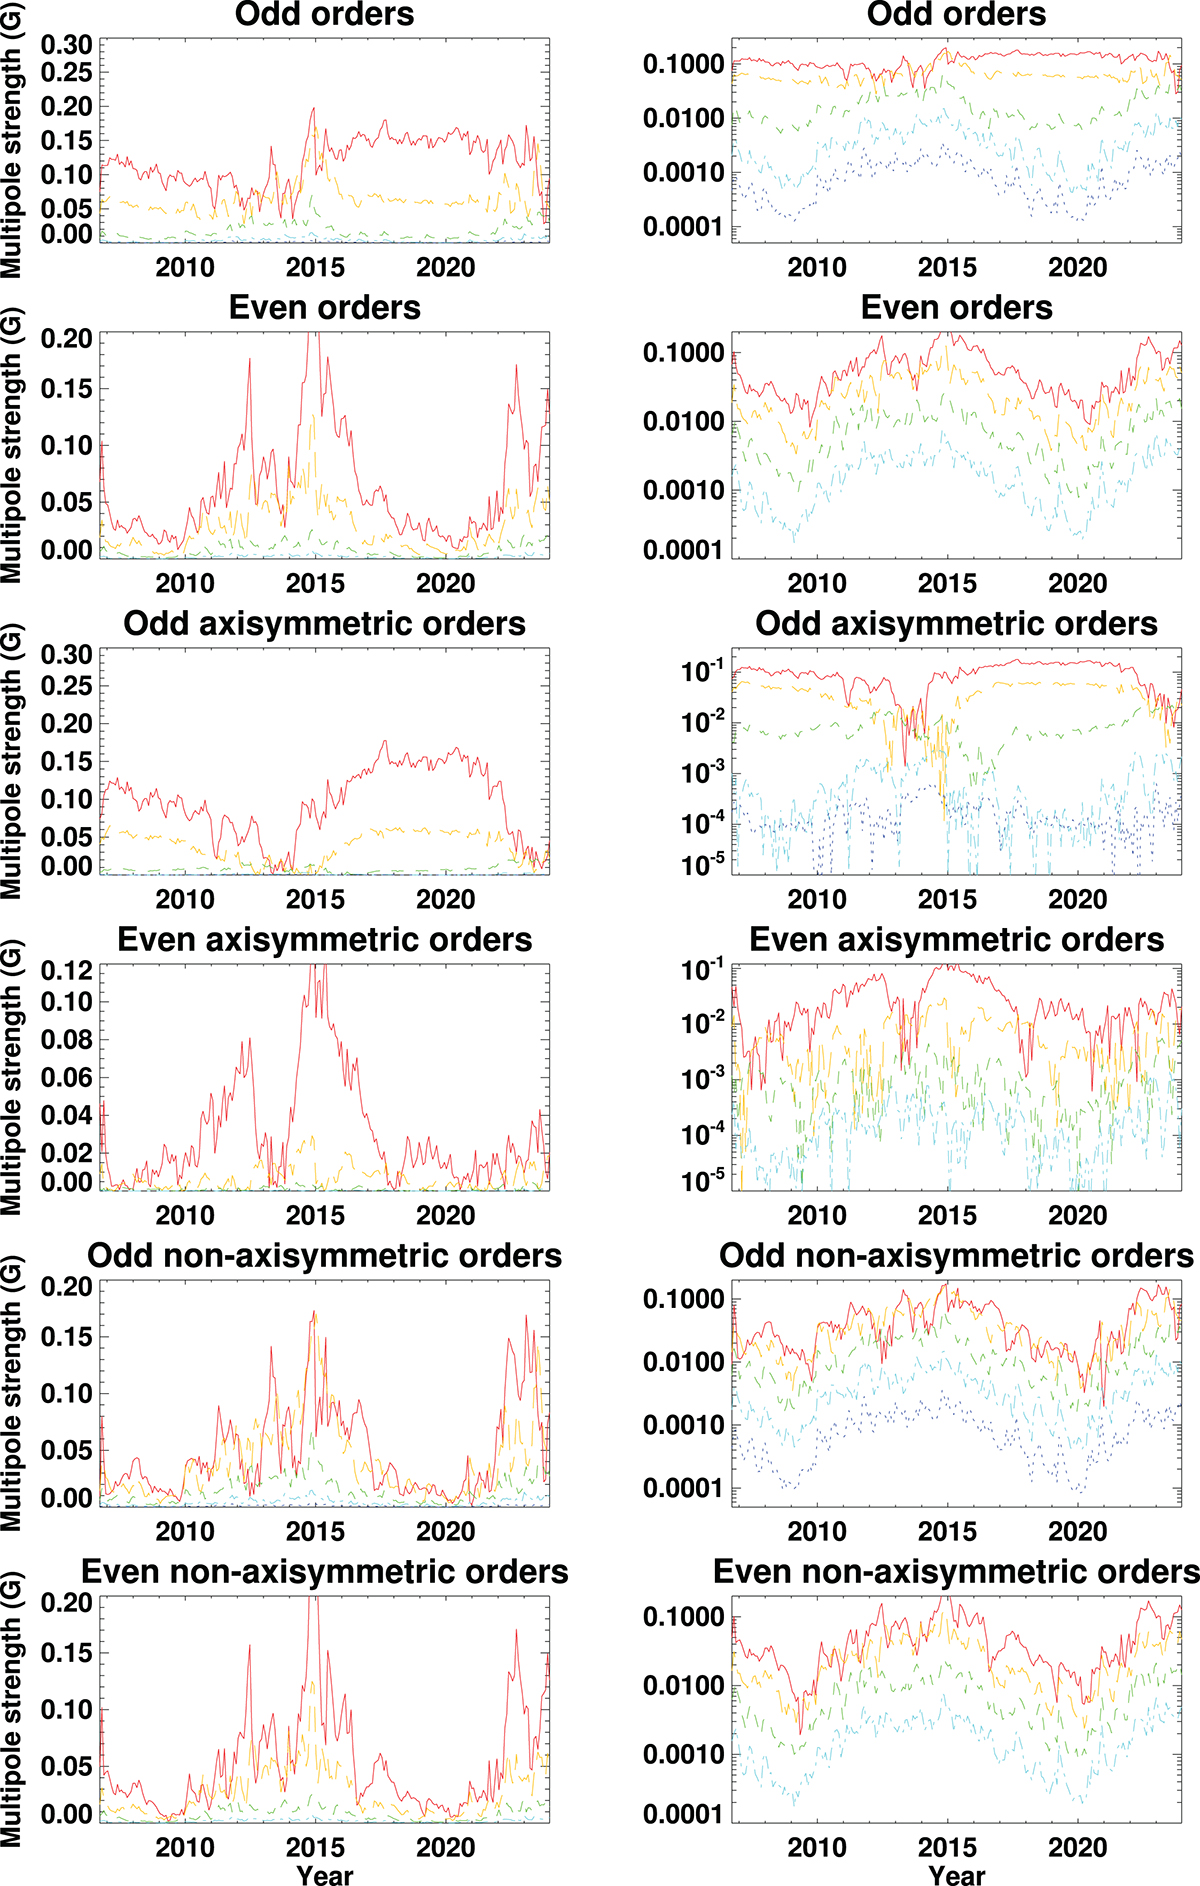
For GONG data the first several even- and odd-order multipole components are plotted, showing the distinct cycle-dependent behavior of the even and odd, and axisymmetric and non-axisymmetric, orders in a systematic way, as indicated in the titles of the plots. The colors identify the numerous multipole components in question, with warm-to-cold colors denoting low-to-high orders. For odd orders, red, amber, green, cyan, and blue represent fields with n = 1, 3, 5, 7, 9, respectively. For even orders, red, amber, green, and cyan represent fields with n = 2, 4, 6, 8, respectively. The right column is the same as the left but scaled logarithmically to enhance the visibility of the signal in the higher-order components.
Current usage metrics show cumulative count of Article Views (full-text article views including HTML views, PDF and ePub downloads, according to the available data) and Abstracts Views on Vision4Press platform.
Data correspond to usage on the plateform after 2015. The current usage metrics is available 48-96 hours after online publication and is updated daily on week days.
Initial download of the metrics may take a while.


