Figure 1
Download original image
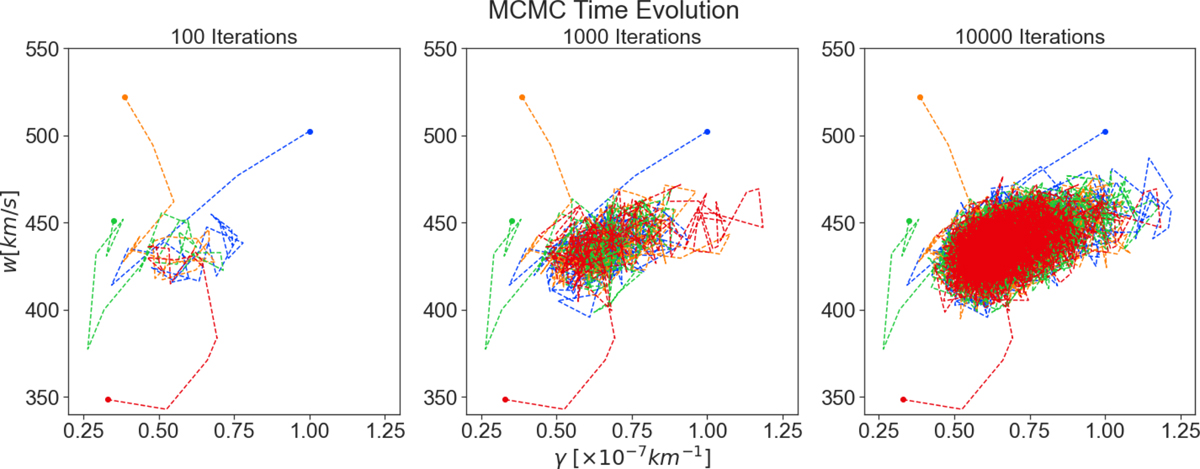
MCMC evolution plot showing three different states of the algorithm’s evolution for the slow ensemble. The starting points (shown as dots) of the four chains are drawn from a density that is over-dispersed with respect to the target density, and progressively they all end up sampling the same area of the parameter space defined by γ and w. The first plot shows 100 iterations, the second shows 1000 and the third shows 10,000 iterations.
Current usage metrics show cumulative count of Article Views (full-text article views including HTML views, PDF and ePub downloads, according to the available data) and Abstracts Views on Vision4Press platform.
Data correspond to usage on the plateform after 2015. The current usage metrics is available 48-96 hours after online publication and is updated daily on week days.
Initial download of the metrics may take a while.