Figure 5
Download original image
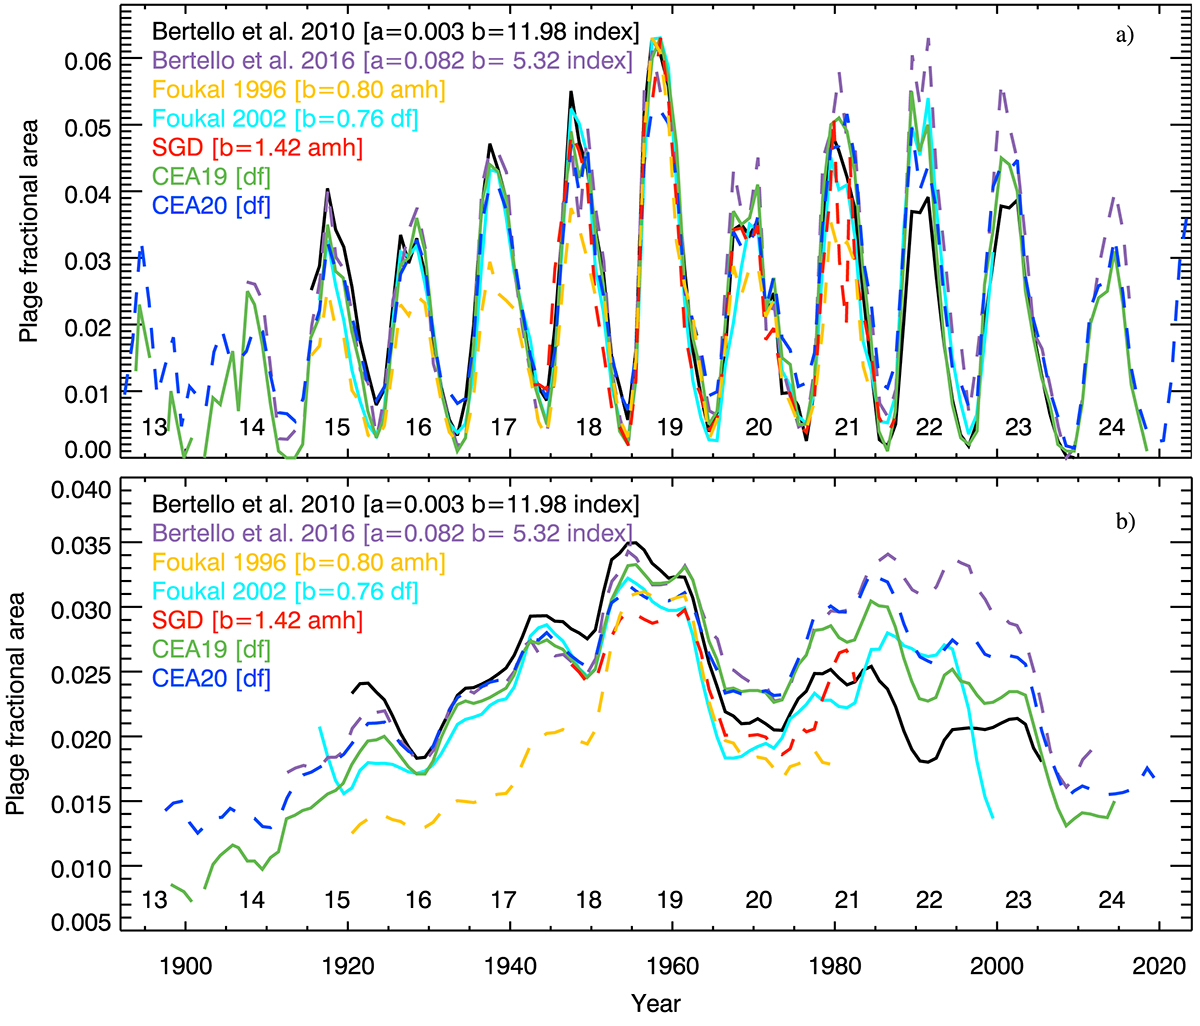
Selected timeseries of plage areas and 1 Å emission indices derived from full-disc Ca II K observations that have been used for irradiance reconstructions. Shown are the plage area series by Foukal (1996, from Mt Wilson data; dashed yellow), Foukal (2002, from Mt Wilson and Sacramento Peak data; solid ciel), Solar Geophysical data (SGD, from McMath-Hulbert, Mt Wilson, and Big Bear data; dashed red), Chatzistergos et al. (2019b, CEA19; composite of 9 Ca II K archives; solid green), and updated Chatzistergos et al. (2020c, CEA20; composite of 38 Ca II K archives; dashed blue) (see Sect. 2.2) as well as the 1 Å emission indices by Bertello et al. (2010, using Mt Wilson data; solid black) and Bertello et al. (2016, using Kodaikanal data; dashed purple). The series have been linearly scaled to match CEA19, with the slope (b) and the intercept (a) given in the legend for each series (when missing it means a = 0 and b = 1). The legend also specifies if a series gives projected plage areas as a fraction of the visible solar disc (df for disc fraction), or areas corrected for foreshortening and expressed as fractions of the solar hemisphere (amh, for areas in millionths of solar hemisphere), or as an emission index. The top panel includes annual median values, while the bottom panel shows 11-year running means. The numbers at the lower part of the panels denote the conventional solar cycle numbering.
Current usage metrics show cumulative count of Article Views (full-text article views including HTML views, PDF and ePub downloads, according to the available data) and Abstracts Views on Vision4Press platform.
Data correspond to usage on the plateform after 2015. The current usage metrics is available 48-96 hours after online publication and is updated daily on week days.
Initial download of the metrics may take a while.