Figure 5

Download original image
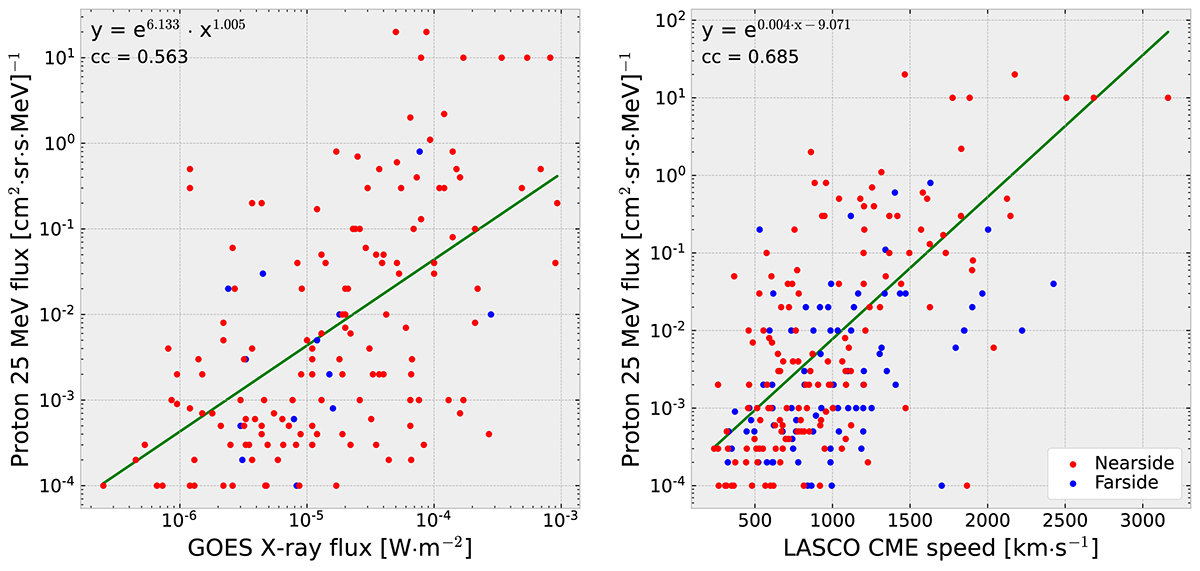
Empirical relationships between the maximum proton flux at 25 MeV and (left) the GOES X-ray flux as well as (right) the LASCO plane-of-sky CME speed for SEP events detected at Earth between December 2006 and February 2018. The plot distinguishes between near-sided (red) and far-sided (blue) events. The best-fit curves shown in green are applied to the near-sided data only. The top left corner of both panels shows the corresponding equation for the best-fit curve and the Pearson correlation coefficient.
Current usage metrics show cumulative count of Article Views (full-text article views including HTML views, PDF and ePub downloads, according to the available data) and Abstracts Views on Vision4Press platform.
Data correspond to usage on the plateform after 2015. The current usage metrics is available 48-96 hours after online publication and is updated daily on week days.
Initial download of the metrics may take a while.


