Figure 5
Download original image
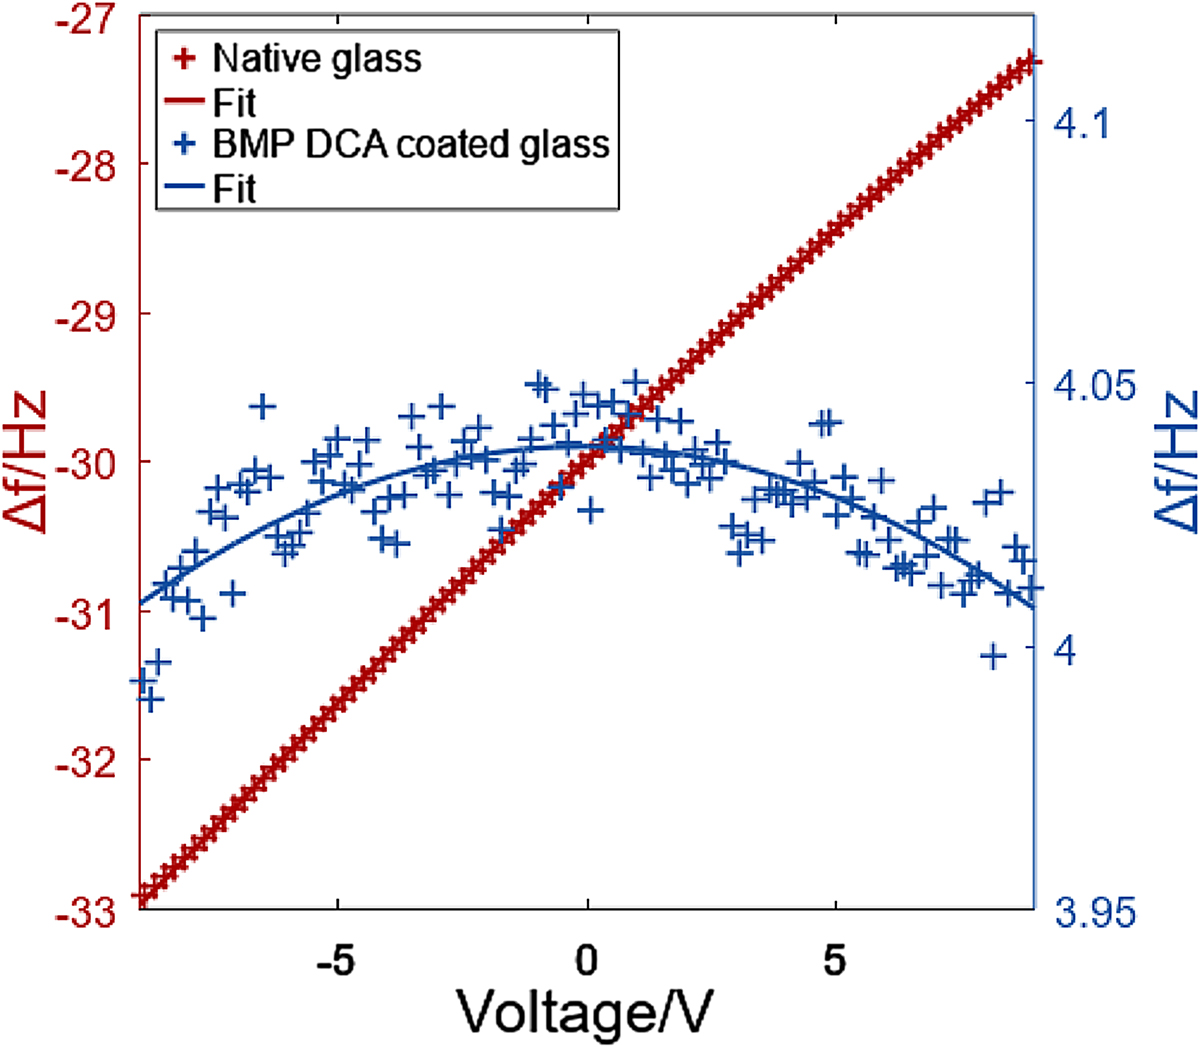
df-V-spectroscopy curves for glass with gold nanostructures (red) and glass with gold nanostructures and BMP DCA coating (blue) after exposure to ∼1017 e/m2 each. Tip material: Pt/Ir Crosses indicate experimental data, continuous lines the parabolic least-square fits. Red fit: −0.00016 Hz/V2 × (V−97 V)2−15 Hz; blue fit: −0.00037 Hz/V2 × (V−0.08 V)2+4 Hz.
Current usage metrics show cumulative count of Article Views (full-text article views including HTML views, PDF and ePub downloads, according to the available data) and Abstracts Views on Vision4Press platform.
Data correspond to usage on the plateform after 2015. The current usage metrics is available 48-96 hours after online publication and is updated daily on week days.
Initial download of the metrics may take a while.