Figure 10
Download original image
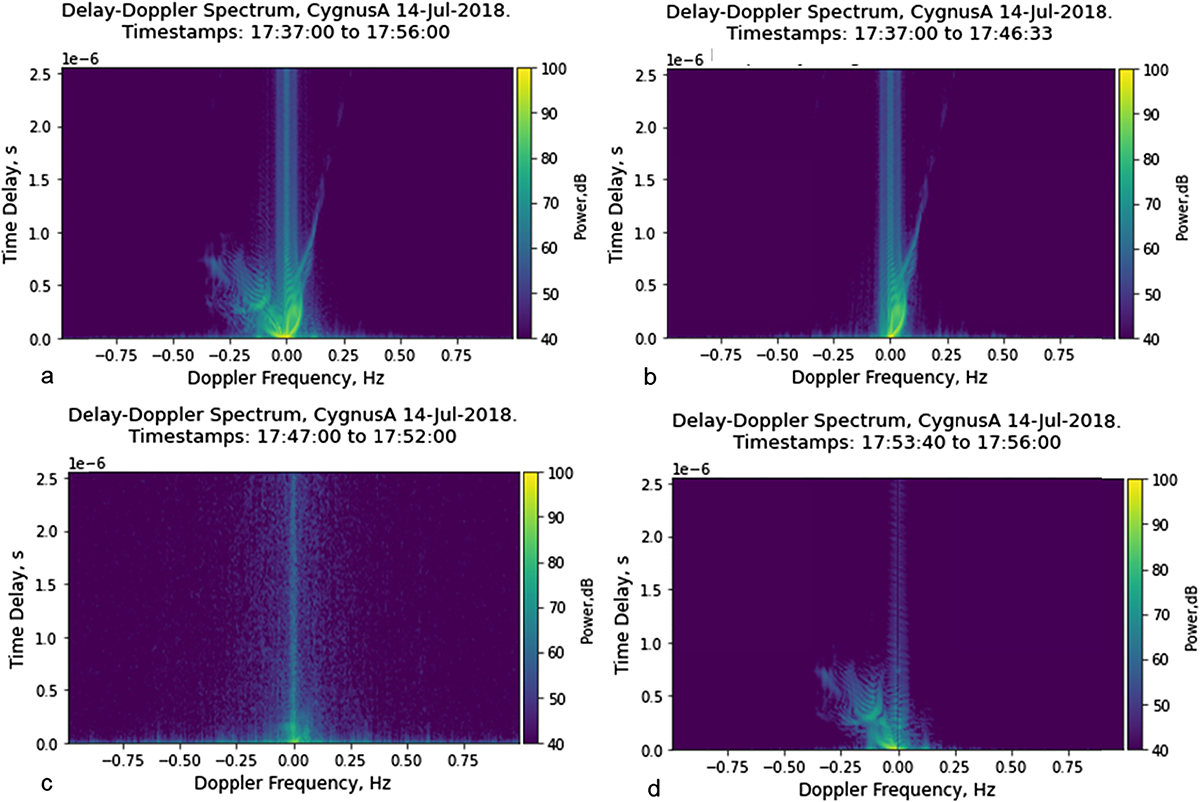
The delay-Doppler spectra of the observation of Cygnus A made by LOFAR station RS508 on 14th July 2018 showing the power as a function of the Doppler frequency and time delay. Panel a shows the delay-Doppler spectrum for observations between 17:37:00 UT and 17:56:00 UT, whereas the other panels show spectra for subsets of these times. Panel b shows observations between 17:37:00 UT and 17:46:33 UT, panel c shows observations between 17:47:00 UT and 17:52:00 UT and panel d shows observations between 17:53:40 UT and 17:56:00 UT. All panels show frequencies between 29.8 MHz and 64.0 MHz.
Current usage metrics show cumulative count of Article Views (full-text article views including HTML views, PDF and ePub downloads, according to the available data) and Abstracts Views on Vision4Press platform.
Data correspond to usage on the plateform after 2015. The current usage metrics is available 48-96 hours after online publication and is updated daily on week days.
Initial download of the metrics may take a while.