Figure 2
Download original image
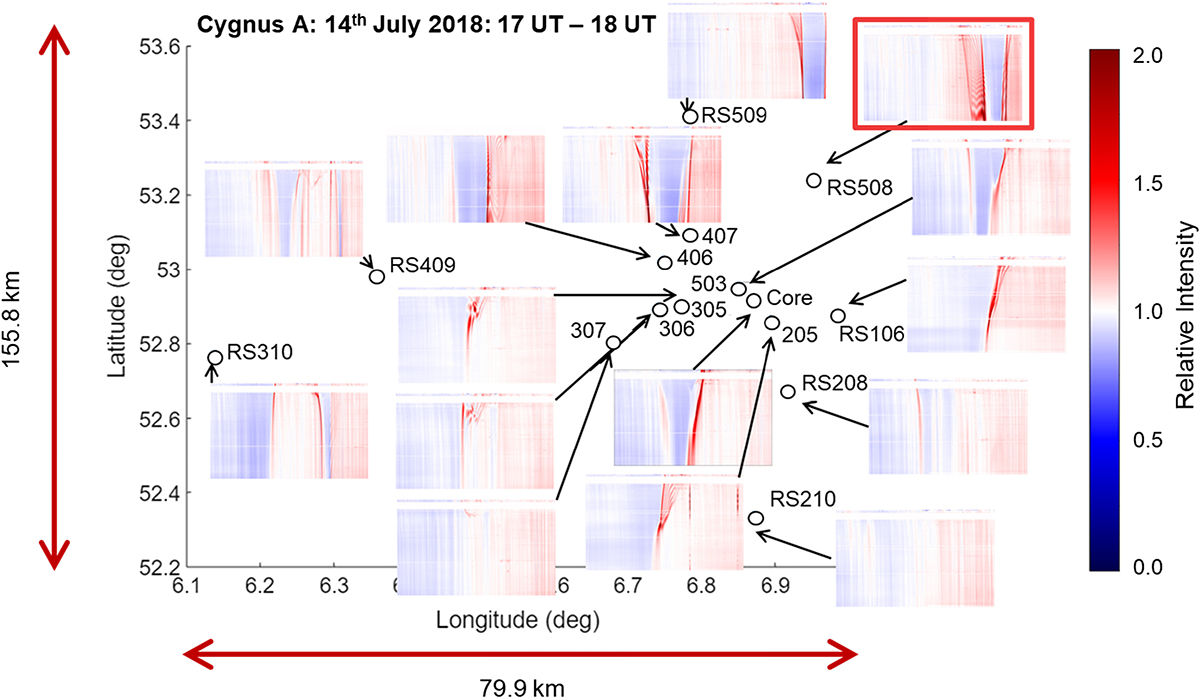
The dynamic spectra showing the relative signal intensity as a function of time and frequency for an observation of Cygnus A made by the LOFAR remote stations across the Netherlands on 14th July 2018 between 17:00 UT and 18:00 UT. The 24 closely spaced stations comprising the LOFAR core, some with separations as small as ~100 m, are labelled as ‘Core’ and the dynamic spectrum for CS002 is shown. To enhance the clarity of this figure, both the intensity scale and time axes differ from Figure 1 and the prefix RS is removed from selected stations. The relative signal intensity is shown on a scale between 0 and 2, with white representing a relative signal intensity of 1.0 and the duration of the time axis is one hour.
Current usage metrics show cumulative count of Article Views (full-text article views including HTML views, PDF and ePub downloads, according to the available data) and Abstracts Views on Vision4Press platform.
Data correspond to usage on the plateform after 2015. The current usage metrics is available 48-96 hours after online publication and is updated daily on week days.
Initial download of the metrics may take a while.