Figure 3
Download original image
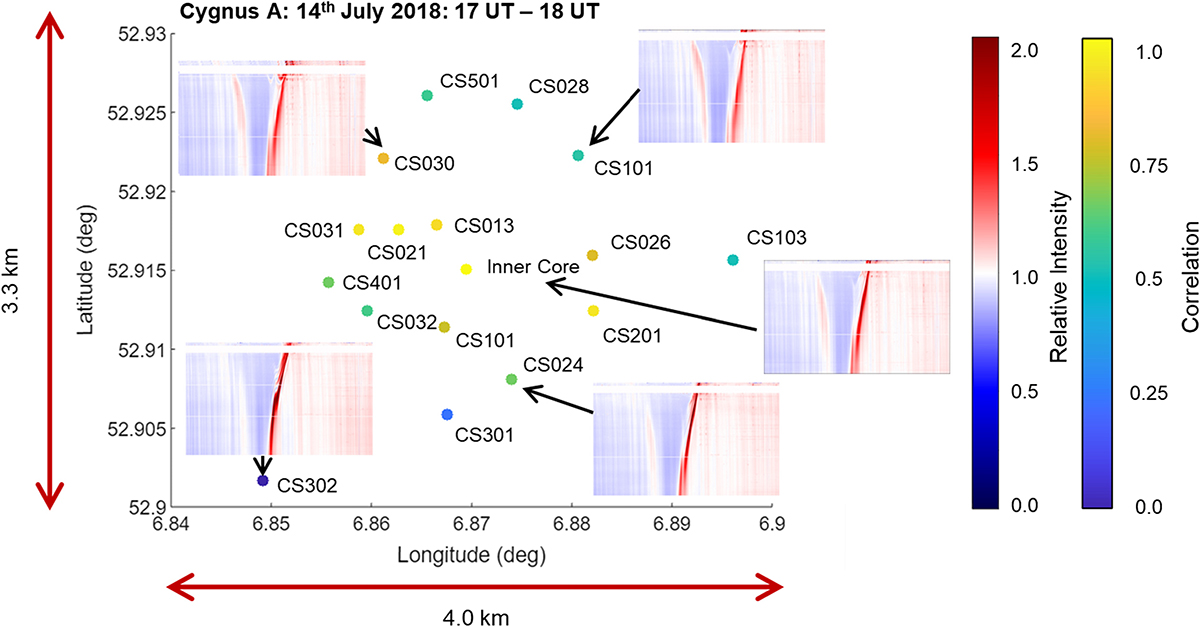
The dynamic spectra showing the relative signal intensity as a function of time and frequency for an observation of Cygnus A made by selected LOFAR core stations across the Netherlands on 14th July 2018 between 17:00 UT and 18:00 UT. Nine closely spaced stations (CS001, CS002, CS003, CS004, CS005, CS006, CS007, CS011 and CS017), some with separations as small as ~100 m, are labelled as ‘Inner Core’ and the dynamic spectrum for CS002 is shown. The colour scale for the relative signal intensity and the time axis are the same as in Figure 2. The station locations for all core stations are colour-coded to show the correlation at zero lag between each station and CS002 at a frequency of 44.5 MHz. The correlation for the Inner Core is the mean value of the correlations at zero lag of CS002 with each of the other seven inner core stations.
Current usage metrics show cumulative count of Article Views (full-text article views including HTML views, PDF and ePub downloads, according to the available data) and Abstracts Views on Vision4Press platform.
Data correspond to usage on the plateform after 2015. The current usage metrics is available 48-96 hours after online publication and is updated daily on week days.
Initial download of the metrics may take a while.