Open Access
Figure 5

Download original image
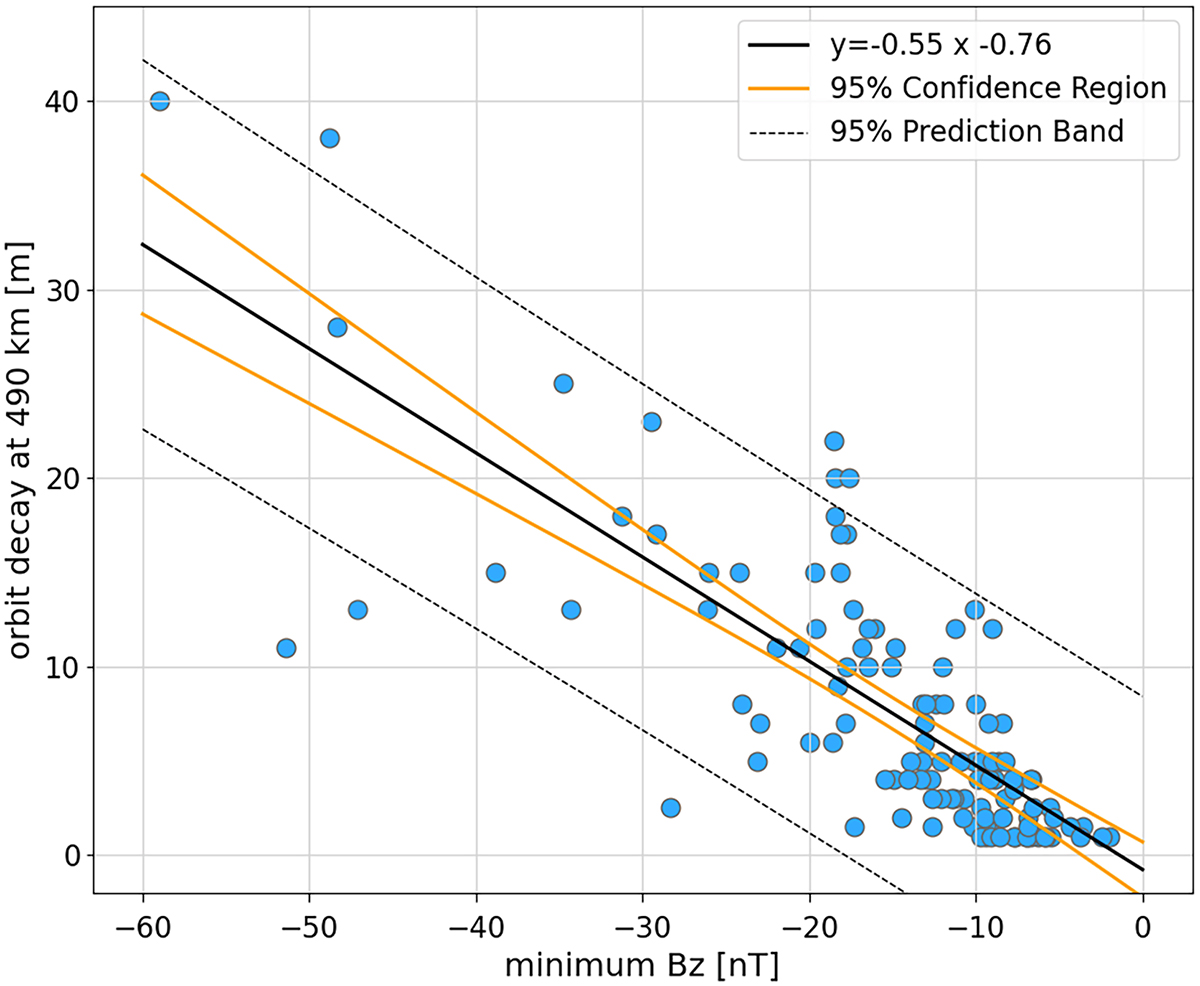
Scatter plot of the minimum Bz component measured by the Advanced Composition Explorer with the storm-induced orbit decay at 490 km comprising the 116 ICME events used for the SODA establishment. Indicated with black dashed lines is the 95% prediction band and with solid orange lines the 95% confidence interval.
Current usage metrics show cumulative count of Article Views (full-text article views including HTML views, PDF and ePub downloads, according to the available data) and Abstracts Views on Vision4Press platform.
Data correspond to usage on the plateform after 2015. The current usage metrics is available 48-96 hours after online publication and is updated daily on week days.
Initial download of the metrics may take a while.


