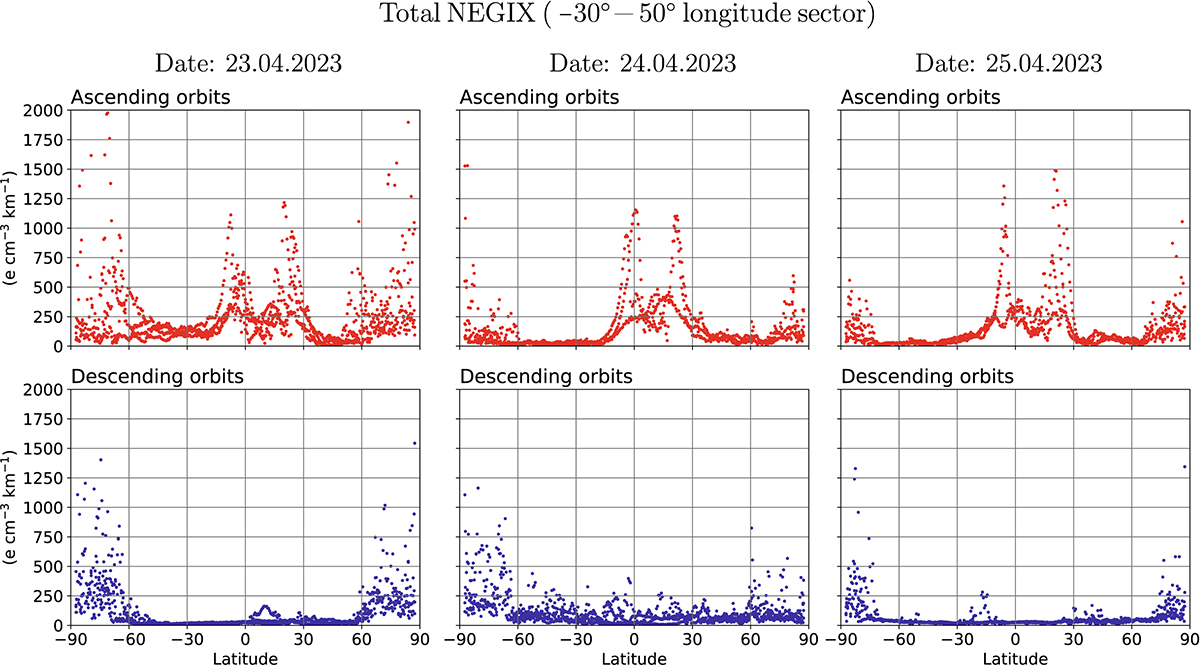
Figure D1

Download original image
The values of the total NeGIX index obtained during and after the geomagnetic storm of April 23–24, 2023 for the longitudinal sector correspond to those in Figures 4 and 5. Both the ascending (Earth’s day side) and descending (night side) parts of the Swarm A and C orbits were considered and each figure contains several passages of the satellites. The ascending passages on April 23 and the descending passages on April 24 took place under the most disturbed conditions (Kp index = 8). The NeGIX during these passages shows in general higher values.
Current usage metrics show cumulative count of Article Views (full-text article views including HTML views, PDF and ePub downloads, according to the available data) and Abstracts Views on Vision4Press platform.
Data correspond to usage on the plateform after 2015. The current usage metrics is available 48-96 hours after online publication and is updated daily on week days.
Initial download of the metrics may take a while.


