Figure 3

Download original image
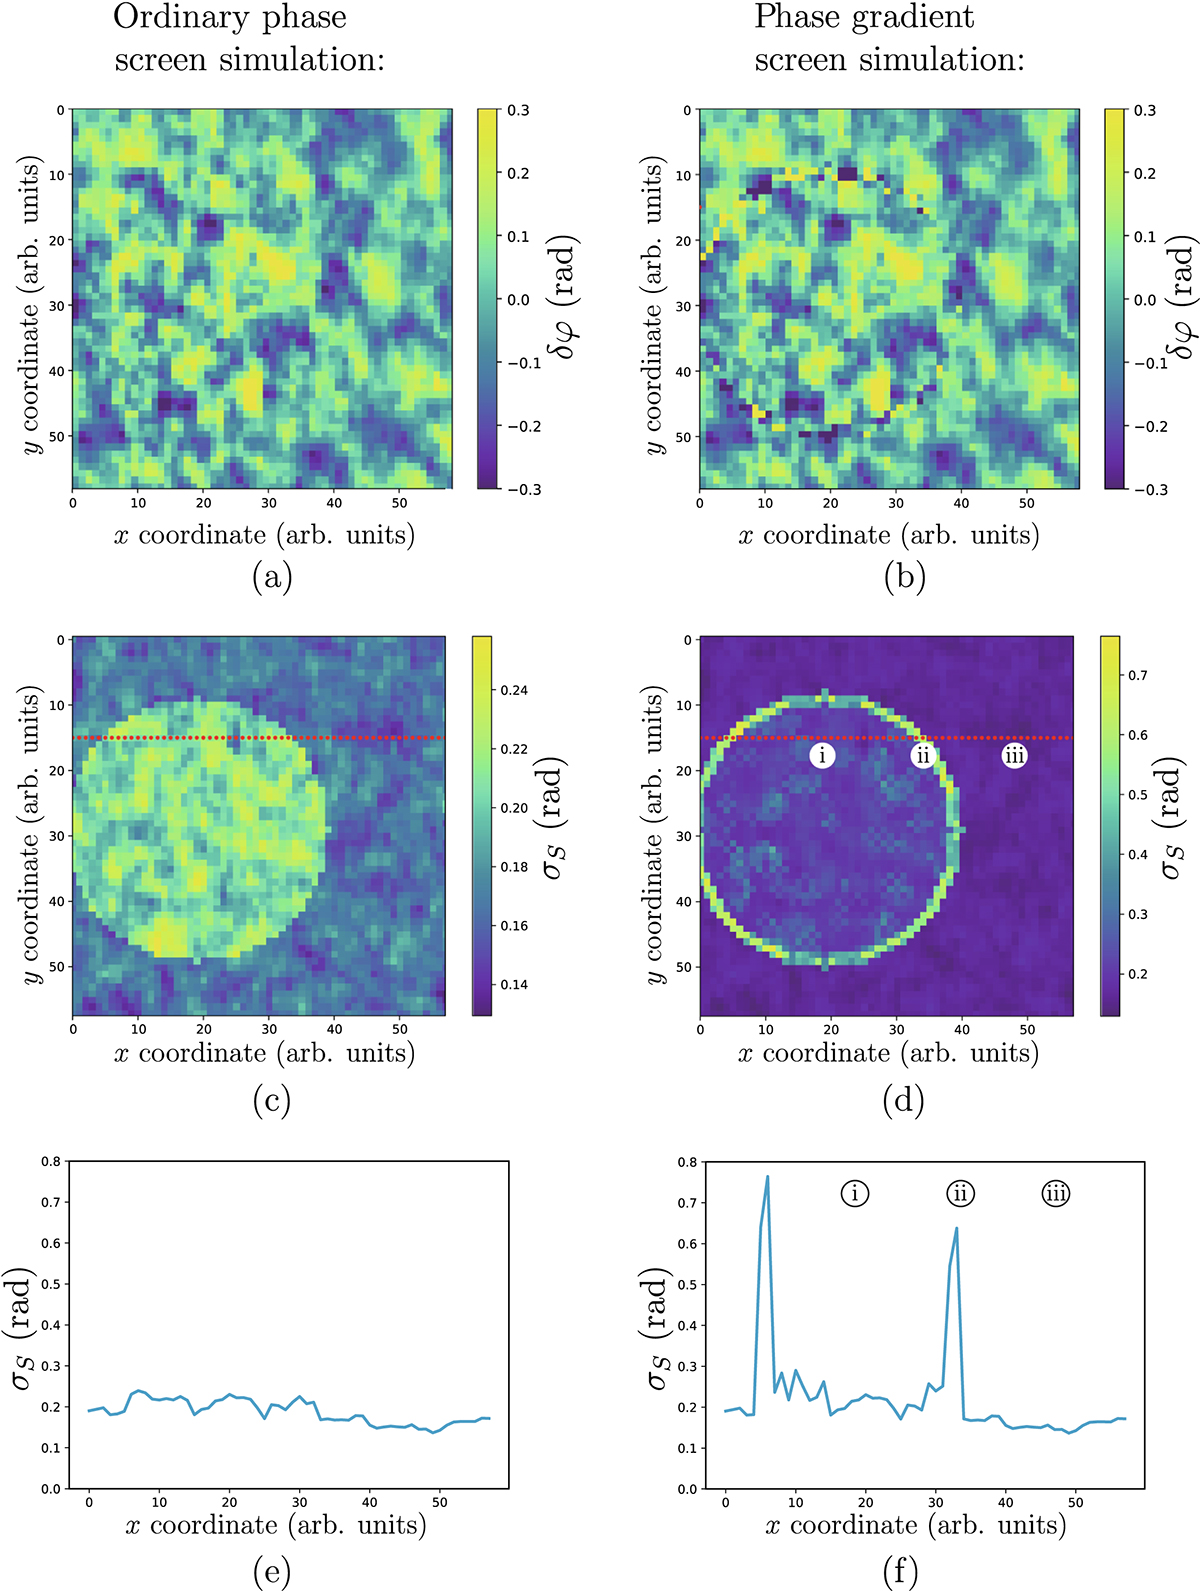
Comparison of the simulation results of the split-step algorithm using the conventional random phase screen approach (a), (c), (e) and the phase derivative method (b), (d), (f). Figures (a) and (b) show the random phase screens generated by the respective methods. Multiple simulations of radio wave propagation through these screens yield the corresponding phase scintillation indices (c) and (d). Here, the red dotted line shows the possible satellite ground track and the figures (e), (f) show the corresponding scintillation index records along the track. The markers i, ii, iii along the track in plot (d) refer to the propagation scenarios shown schematically in Figure 2 (a).
Current usage metrics show cumulative count of Article Views (full-text article views including HTML views, PDF and ePub downloads, according to the available data) and Abstracts Views on Vision4Press platform.
Data correspond to usage on the plateform after 2015. The current usage metrics is available 48-96 hours after online publication and is updated daily on week days.
Initial download of the metrics may take a while.


