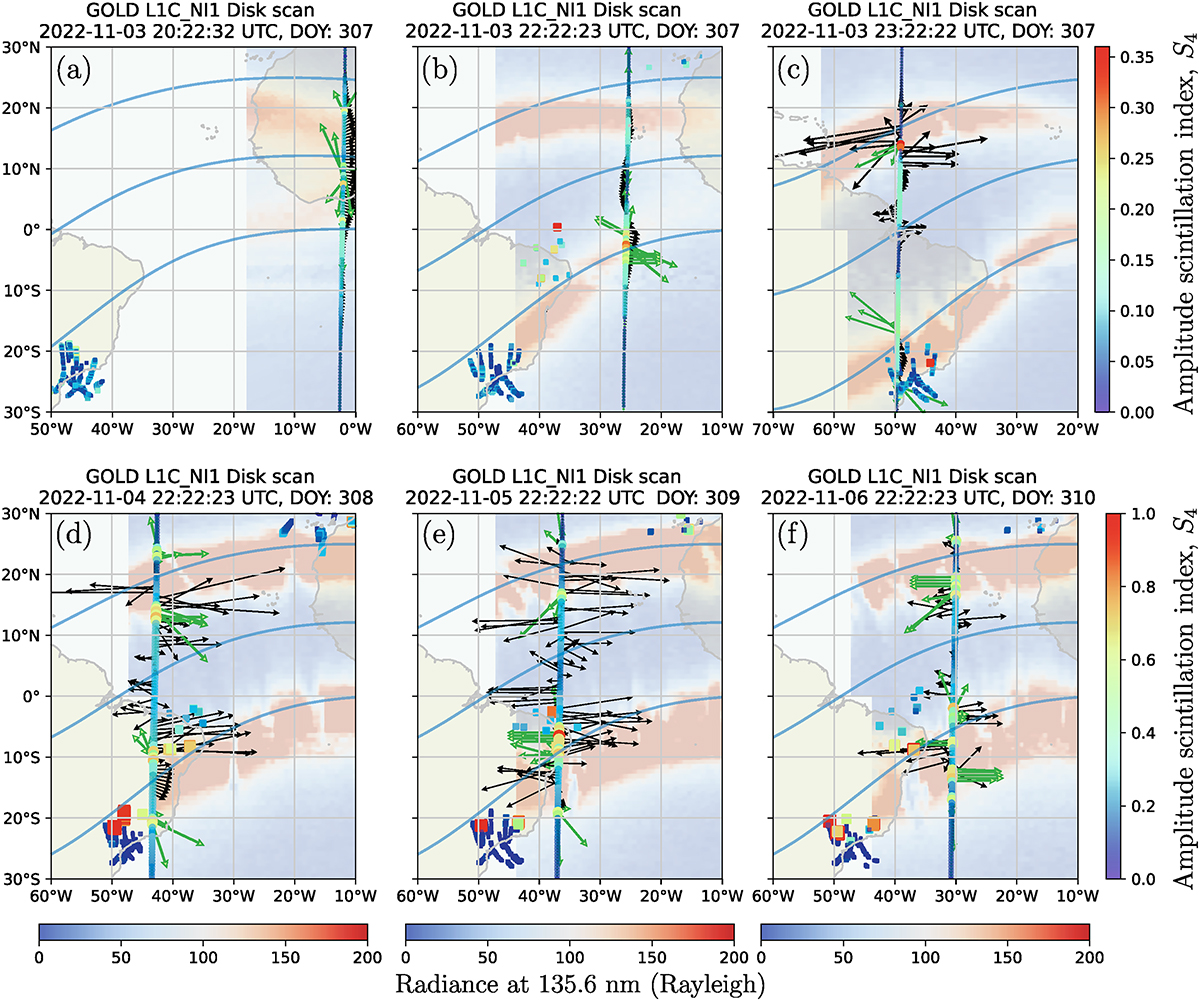
Figure 6

Download original image
Comparison of the simulated amplitude scintillation indices (circles) with the empirical data (squares) for the low latitude region over Africa, the Atlantic Ocean, and South America. As a reference to the possible plasma bubble shapes, the background image shows the atmospheric emission radiance obtained from the GOLD mission data. The green vectors represent the gradient values of the mask extracted from the GOLD images and the black vectors correspond to the Swarm NeGIX index.
Current usage metrics show cumulative count of Article Views (full-text article views including HTML views, PDF and ePub downloads, according to the available data) and Abstracts Views on Vision4Press platform.
Data correspond to usage on the plateform after 2015. The current usage metrics is available 48-96 hours after online publication and is updated daily on week days.
Initial download of the metrics may take a while.


