Figure 9

Download original image
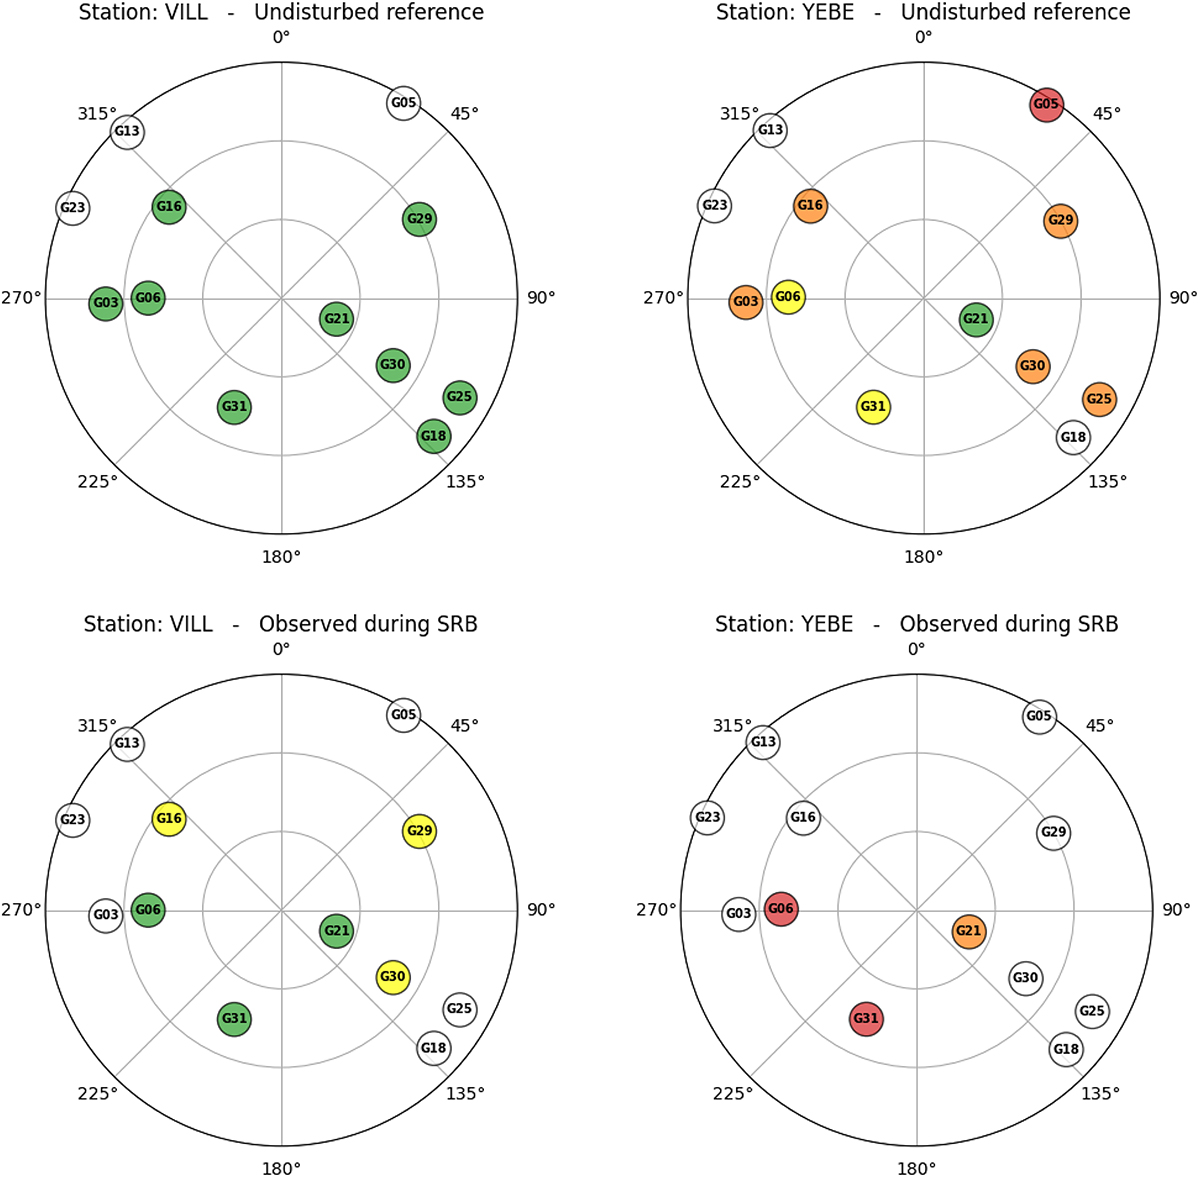
Skyplots with the distribution of GPS satellites and colour-coded L2 signal strength during the SRB on 24 September 2011 at 13:05:30 UTC for IGS stations VILL (left panels) and YEBE (right panels). The colour code is: green (for signal strengths higher than 36 dBHz), yellow (in the range 30–36 dBHz), orange (18–30 dBHz), red (lower than 18 dBHz) and white if the satellite is not available. The thresholds follow the standardized signal strength indicators scale. The top panels indicate the expected undisturbed conditions, while the bottom panels show the conditions observed during the SRB.
Current usage metrics show cumulative count of Article Views (full-text article views including HTML views, PDF and ePub downloads, according to the available data) and Abstracts Views on Vision4Press platform.
Data correspond to usage on the plateform after 2015. The current usage metrics is available 48-96 hours after online publication and is updated daily on week days.
Initial download of the metrics may take a while.


