Figure 1
Download original image
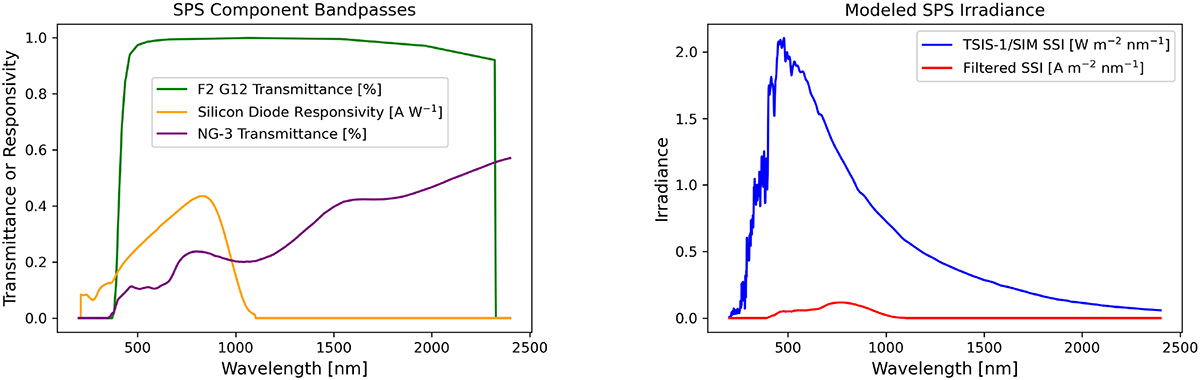
Modeled GOES-R/EXIS SPS signal. (left) The transmittance of the F2 G12 radiation hard glass is shown in green. Responsivity of the silicon diode and the transmittance of the NG-3 neutral density filter are shown in orange and purple, respectively. The modeled SPS is produced by applying these functions to the TSIS-1/SIM spectrum and then integrating over wavelength. (right) The blue curve is a typical full spectrum from TSIS-1/SIM, in units of spectral irradiance [Wm−2 nm−1]. The modeled SPS response is shown as the red curve. Filtered SSI, integrated over wavelength, is the modeled SPS signal (Eq. 3).
Current usage metrics show cumulative count of Article Views (full-text article views including HTML views, PDF and ePub downloads, according to the available data) and Abstracts Views on Vision4Press platform.
Data correspond to usage on the plateform after 2015. The current usage metrics is available 48-96 hours after online publication and is updated daily on week days.
Initial download of the metrics may take a while.