Figure 5
Download original image
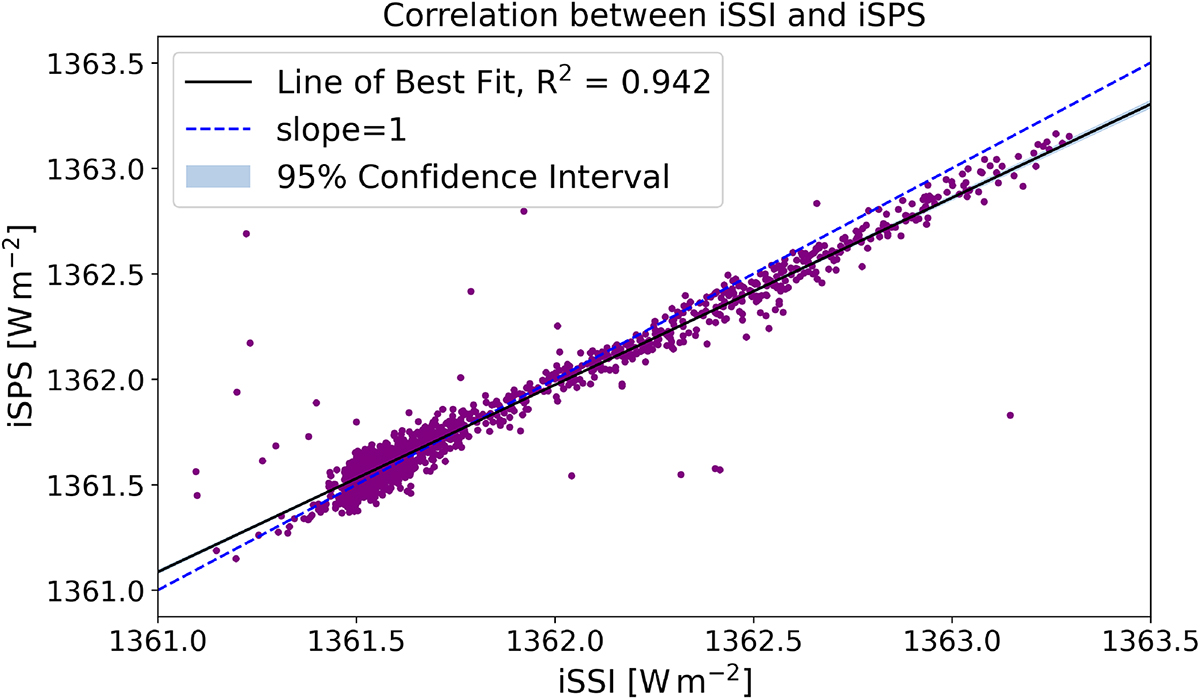
Linear correlation between iSSI and iSPS. The line of best fit is shown with an R2 of 0.942. The 95% confidence interval has an average value of 0.0105 Wm−2, so it is difficult to distinguish from the width of the line. The line with slope = 1 is shown as a dashed curve. The best-fit line has a slope less than one due to the decrease in the difference after 2021 shown in Figure 3.
Current usage metrics show cumulative count of Article Views (full-text article views including HTML views, PDF and ePub downloads, according to the available data) and Abstracts Views on Vision4Press platform.
Data correspond to usage on the plateform after 2015. The current usage metrics is available 48-96 hours after online publication and is updated daily on week days.
Initial download of the metrics may take a while.