Figure 6
Download original image
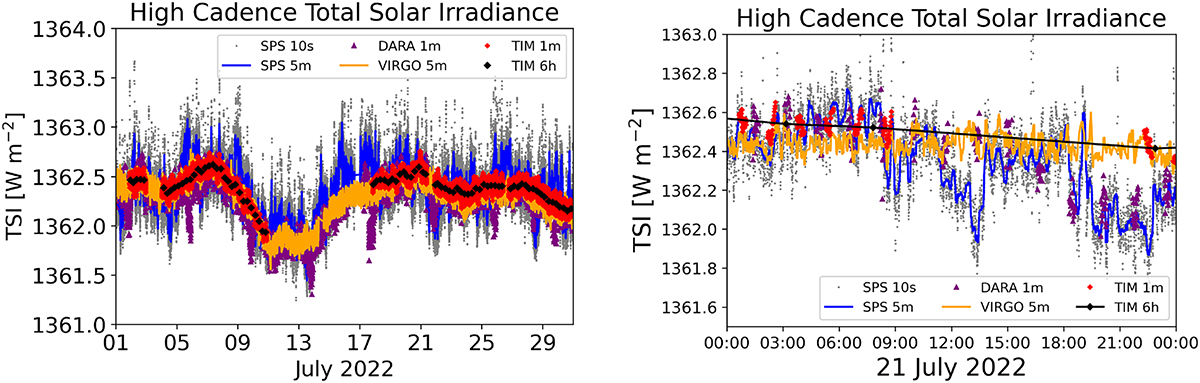
In both panels, the data from SPS is shown as gray dots, and a 5-min median filter of the SPS data is shown as a blue curve. DARA 1-min observations are purple triangles, the orange curve is a 5-min median of the VIRGO observations, and the TSIS-1/TIM data is shown as red diamonds (1-min observations) or a black diamond (6-h average). (left) Datasets for the entire month of July 2022. (right) Datasets for a single day (21 July 2022).
Current usage metrics show cumulative count of Article Views (full-text article views including HTML views, PDF and ePub downloads, according to the available data) and Abstracts Views on Vision4Press platform.
Data correspond to usage on the plateform after 2015. The current usage metrics is available 48-96 hours after online publication and is updated daily on week days.
Initial download of the metrics may take a while.