Figure 1
Download original image
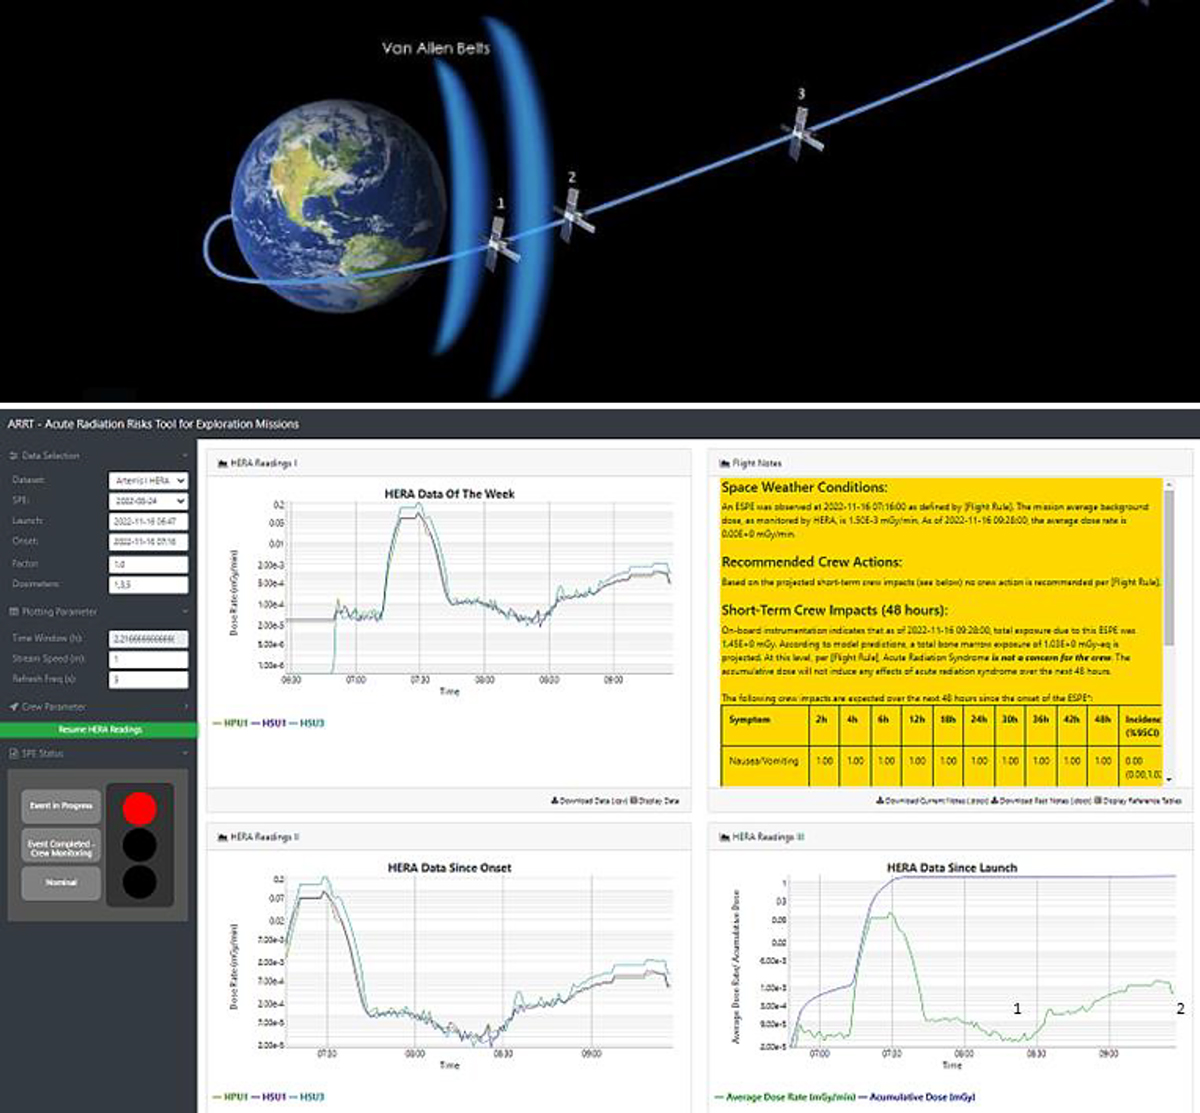
Schematic trajectory of Artemis I passing through the Van Allen Belts (top, courtesy to NASA) and rewind study of ARRT 1.0 (bottom). The average HERA dose rates corresponding to points 1 and 2 in the top trajectory figure are denoted in the right bottom panel in the ARRT interface. For description of the components of ARRT 1.0 interface see the text and the previous report (Hu et al., 2020).
Current usage metrics show cumulative count of Article Views (full-text article views including HTML views, PDF and ePub downloads, according to the available data) and Abstracts Views on Vision4Press platform.
Data correspond to usage on the plateform after 2015. The current usage metrics is available 48-96 hours after online publication and is updated daily on week days.
Initial download of the metrics may take a while.