Open Access
Figure 3
Download original image
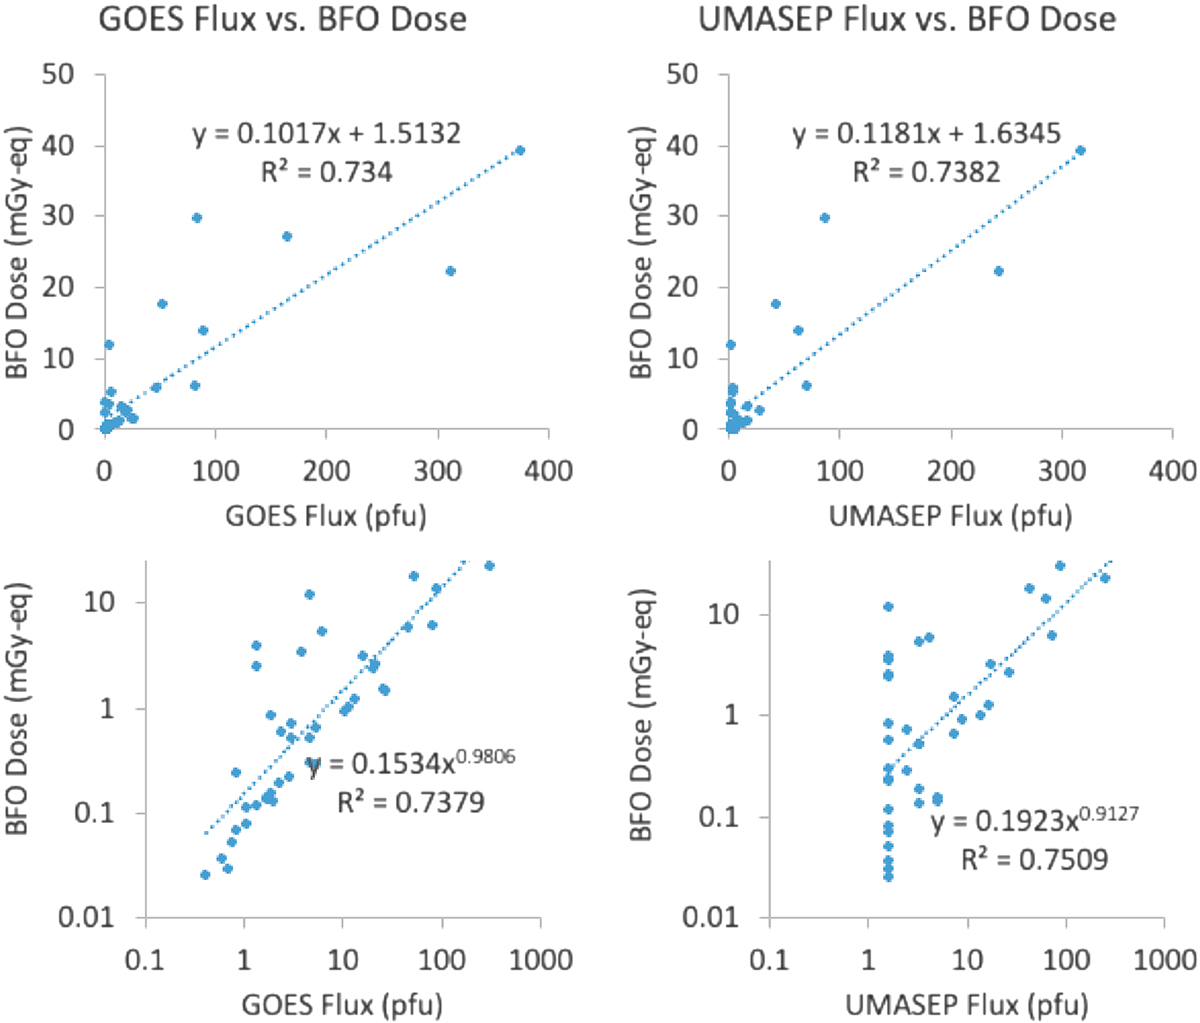
Correlation between proton flux (ST + 3 h) and BFO dose for 44 events observed with GOES (left) and for 40 events modeled with UMASEP-100 v3.4 (right). The flux-dose formulas are embedded in the plots, along with R2 values, for linear and power law fittings.
Current usage metrics show cumulative count of Article Views (full-text article views including HTML views, PDF and ePub downloads, according to the available data) and Abstracts Views on Vision4Press platform.
Data correspond to usage on the plateform after 2015. The current usage metrics is available 48-96 hours after online publication and is updated daily on week days.
Initial download of the metrics may take a while.