Open Access
Figure 5
Download original image
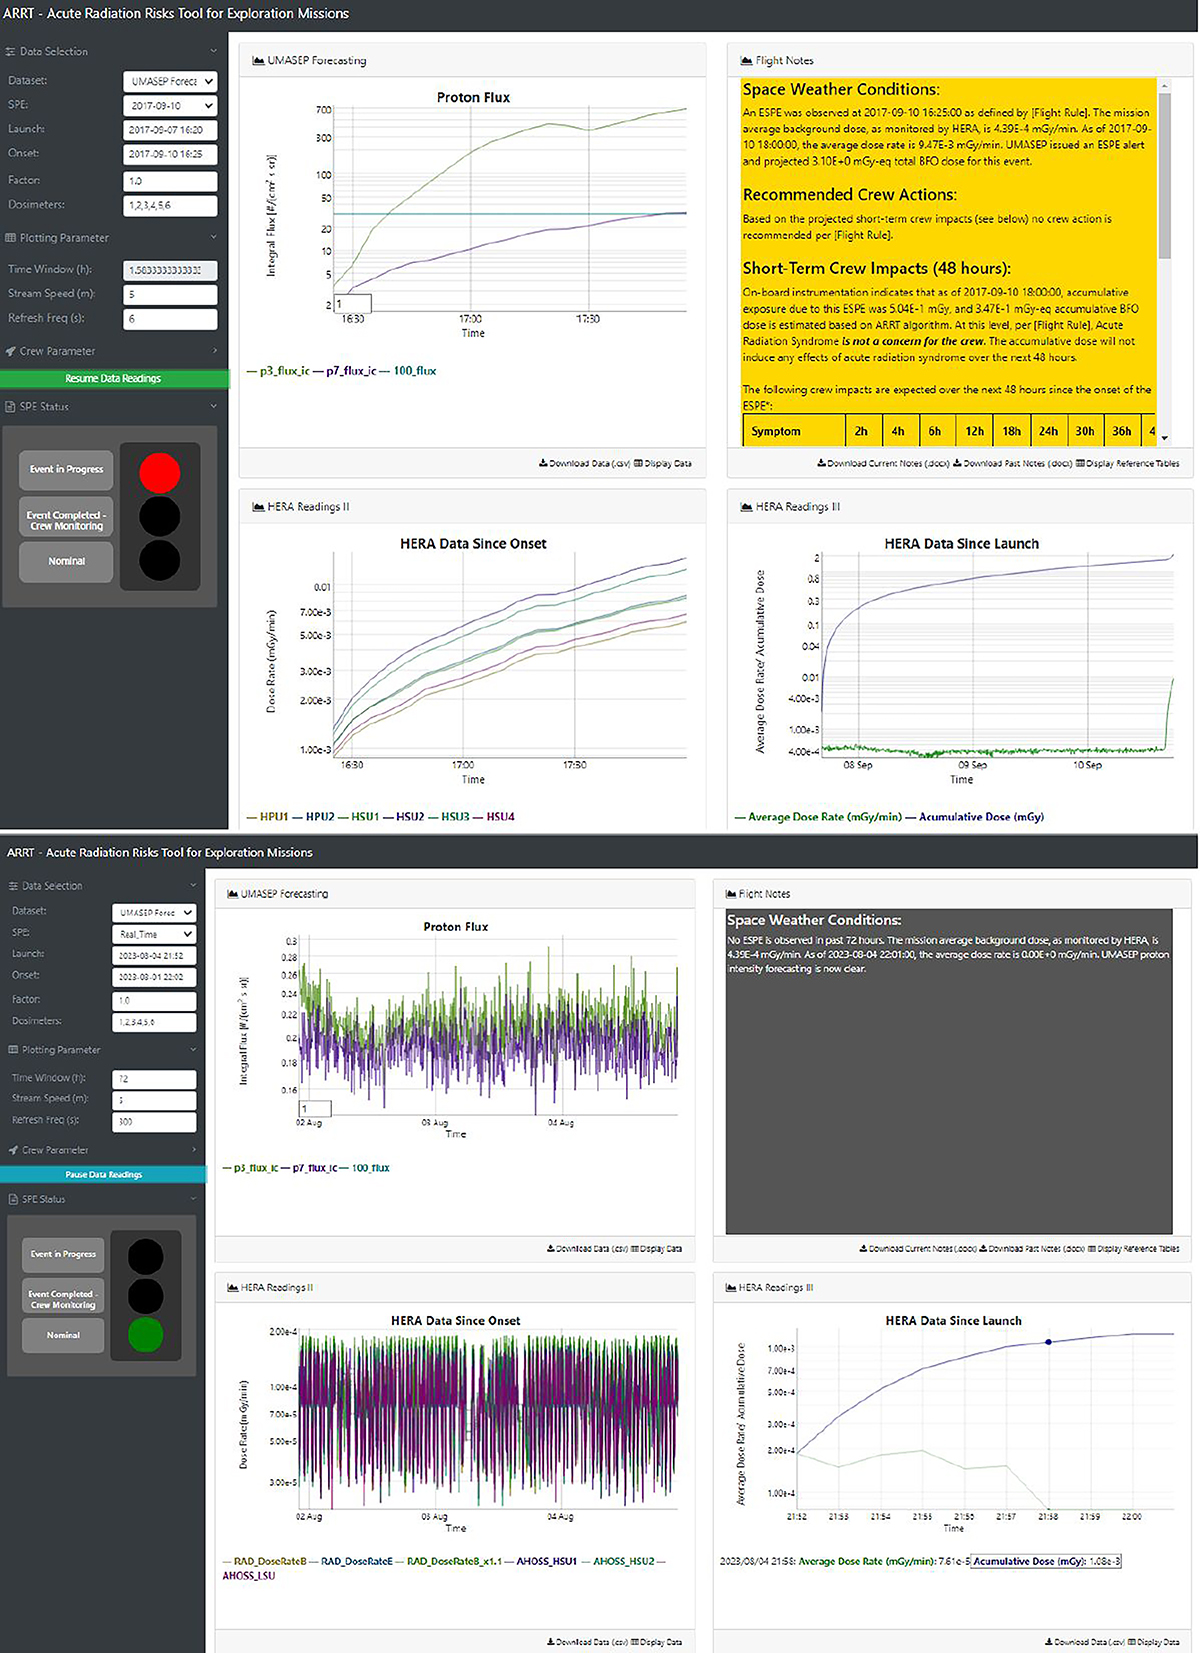
Interface update for ARRT 2.0, after integrating with UMASEP-100. The top panel is for historical events, and the bottom panel is for real time data stream. Detailed description of the interface elements can be found in ARRT 1.0 paper (Hu et al., 2020).
Current usage metrics show cumulative count of Article Views (full-text article views including HTML views, PDF and ePub downloads, according to the available data) and Abstracts Views on Vision4Press platform.
Data correspond to usage on the plateform after 2015. The current usage metrics is available 48-96 hours after online publication and is updated daily on week days.
Initial download of the metrics may take a while.