Figure 11
Download original image
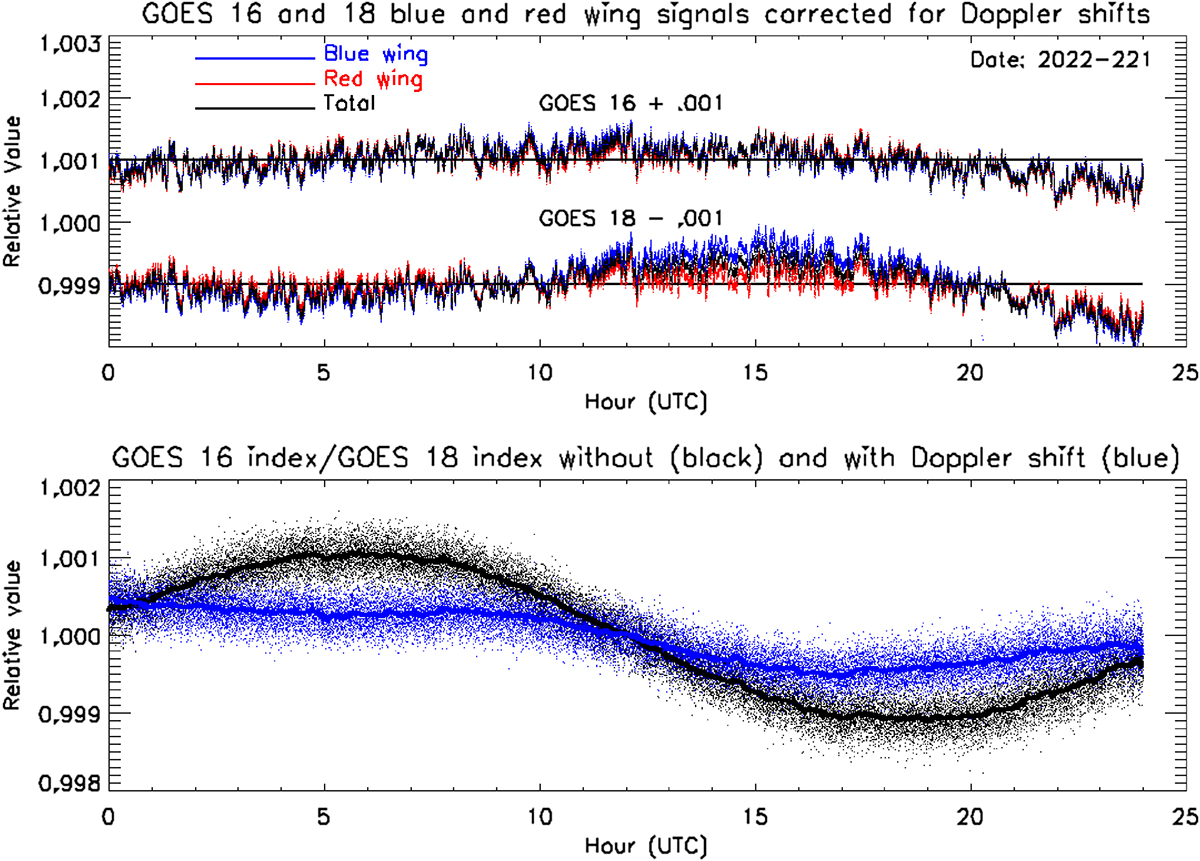
Plots in the top panel are normalized blue wing, red wing, and blue + red wing values that have been computed after removing spacecraft-Sun distance variation and shifting the observed spectra to a common wavelength scale to account for Doppler effects. The bottom panel compares values of the MgIIEXIS index before and after spectral shifting (black and blue, respectively). Shifting to a common wavelength scale largely, but not completely, removes a ±0.1% velocity dependent bias from the index. Solid curves are 30-minute averages of the raw spectra that have a 3-second integration periods.
Current usage metrics show cumulative count of Article Views (full-text article views including HTML views, PDF and ePub downloads, according to the available data) and Abstracts Views on Vision4Press platform.
Data correspond to usage on the plateform after 2015. The current usage metrics is available 48-96 hours after online publication and is updated daily on week days.
Initial download of the metrics may take a while.