Figure 12
Download original image
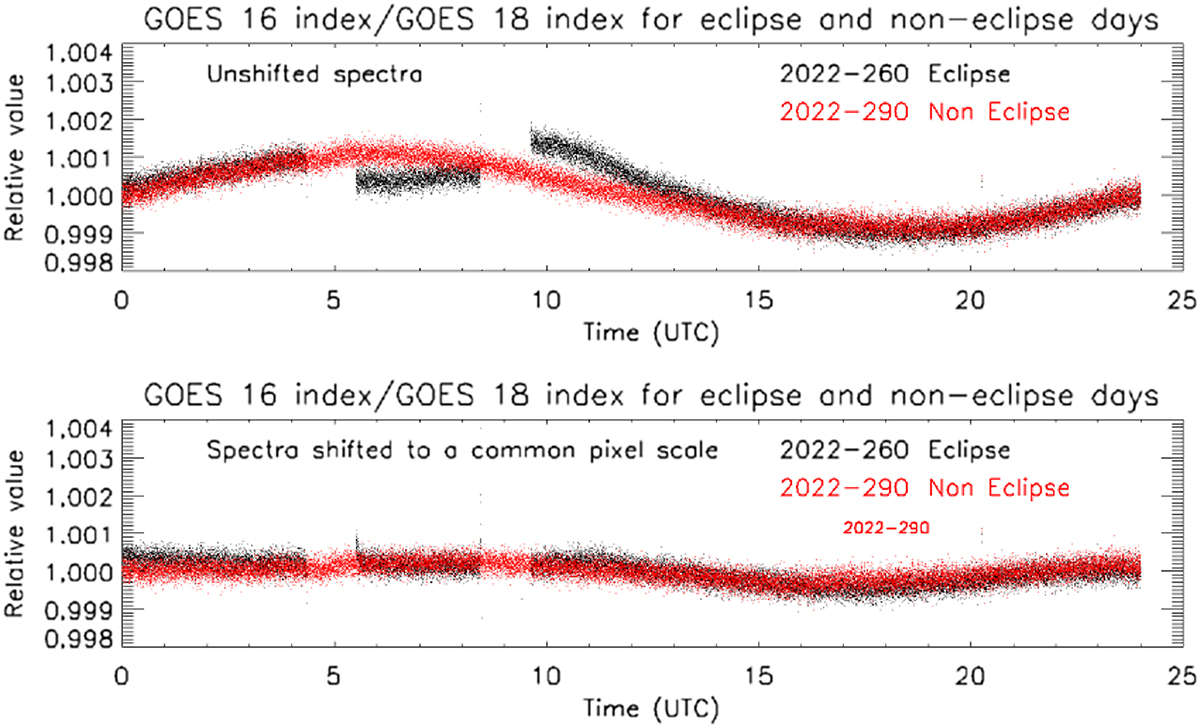
Top panel: Comparison of the GOES-16 MgIIEXIS/GOES-18 MgIIEXIS ratio for an eclipse day (black) and non-eclipse day (red). Indices were calculated using the fixed-mask operational algorithm. Displacements or the black curve relative to the red result from abrupt changes in instrument temperature that occur during eclipse entry. Lower Panel: Ratio comparisons for eclipse and non-eclipse days with indices calculated using the operational algorithm after shifting the spectra from each instrument to its noontime pixel scale as described in Section 4.2.1.
Current usage metrics show cumulative count of Article Views (full-text article views including HTML views, PDF and ePub downloads, according to the available data) and Abstracts Views on Vision4Press platform.
Data correspond to usage on the plateform after 2015. The current usage metrics is available 48-96 hours after online publication and is updated daily on week days.
Initial download of the metrics may take a while.