Figure 14
Download original image
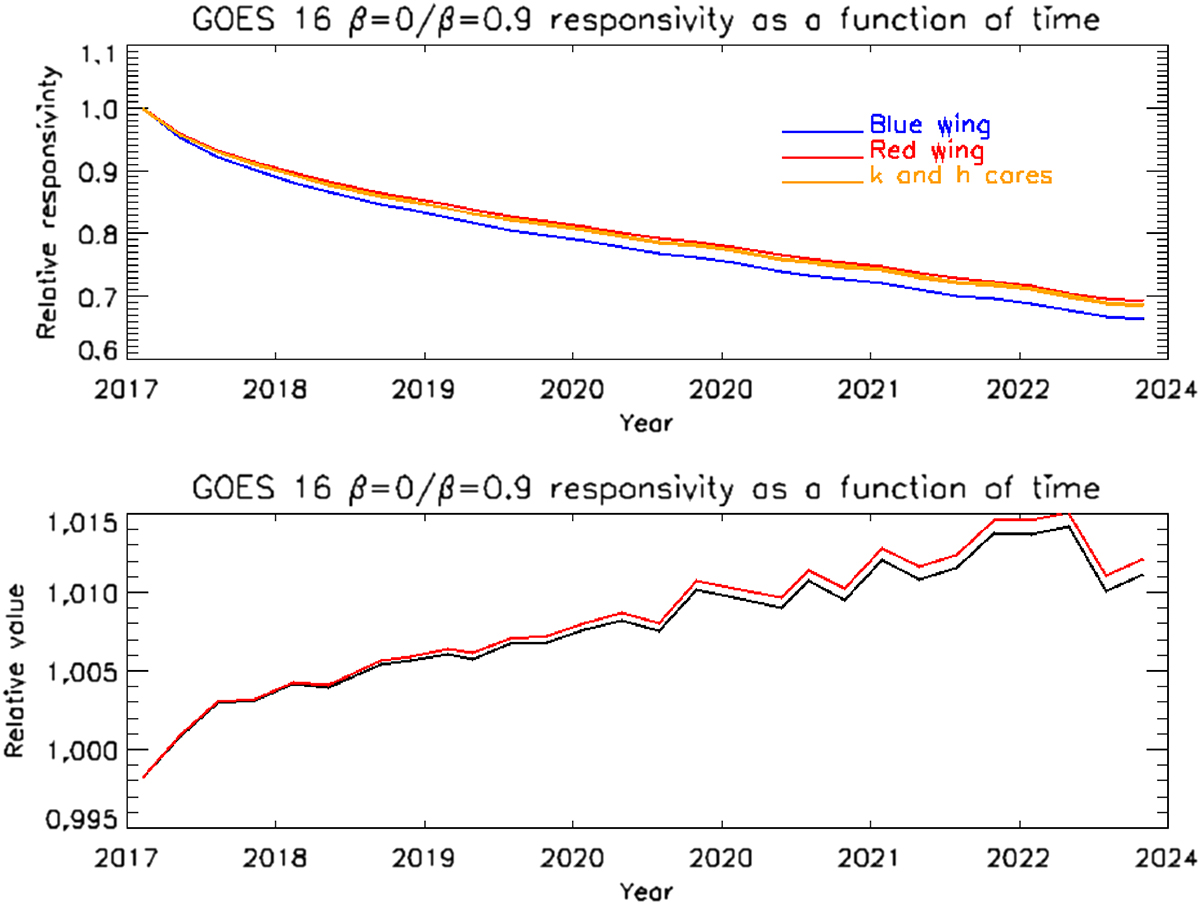
Top panel: Change in the components used to calculate the GOES-16 MgIIEXIS index (Eq. (8)) as a function of time, which is a proxy for solar exposure. The blue wing signal declines more rapidly than the red wing and h and k line signals. Bottom panel: Comparing index values calculated from observations taken quarterly from an offset position from β = 0.9° (black) track the impact of signal decline on the absolute index value. Because spectra taken at β = 0.9° also show very weak sensitivity loss, the β = 0°/β = 0.9° ratio differences must be increased by ~10% (red) in order to calculate the total impact of instrument degradation.
Current usage metrics show cumulative count of Article Views (full-text article views including HTML views, PDF and ePub downloads, according to the available data) and Abstracts Views on Vision4Press platform.
Data correspond to usage on the plateform after 2015. The current usage metrics is available 48-96 hours after online publication and is updated daily on week days.
Initial download of the metrics may take a while.