Figure 6
Download original image
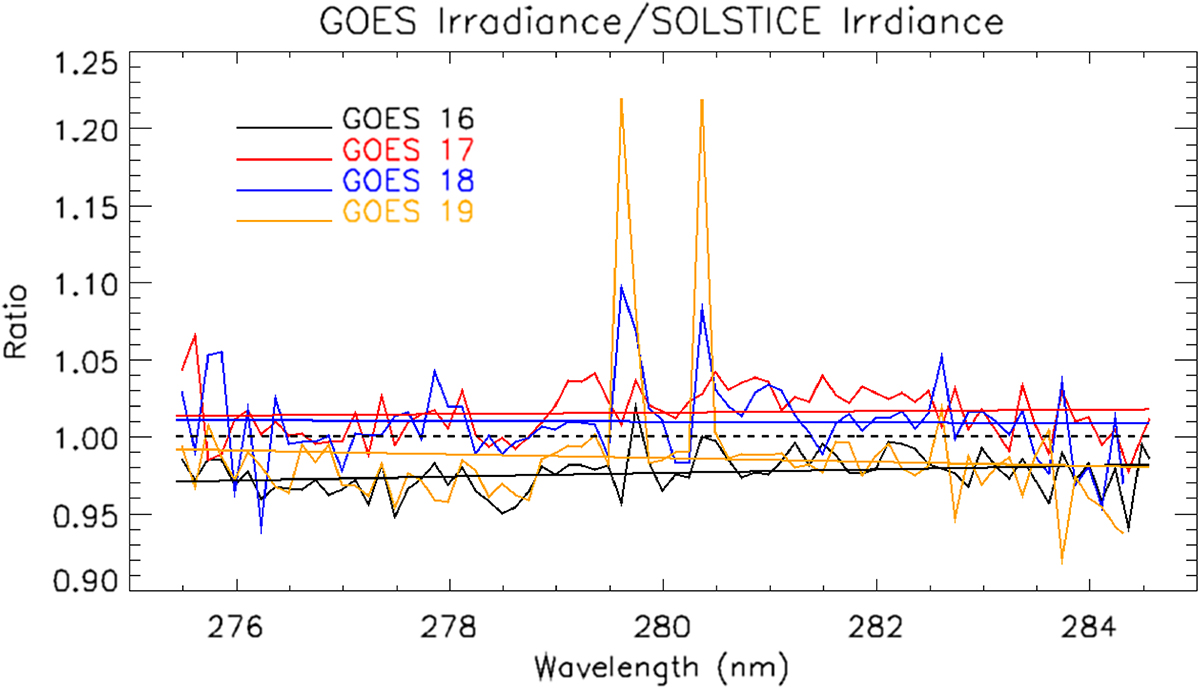
GOES-16/SOLSTICE (black), GOES-17/SOLSTICE (red), GOES-18/SOLSTICE (blue), and GOES-19/SOLSTICE (orange) sampled at 0.1 nm per spectral bin. Also shown are linear fits to the ratios and a dashed line for Ratio = 1. The ~10% and 25% larger MgII h and k emissions observed for GOES-18 and GOES-19 are consistent with the uncertainty in extrapolating MgII emissions in the SOLSTICE spectra from July 4, 2019 and September 18, 2019 to 2022 and 2024 (Woods et al., 2018).
Current usage metrics show cumulative count of Article Views (full-text article views including HTML views, PDF and ePub downloads, according to the available data) and Abstracts Views on Vision4Press platform.
Data correspond to usage on the plateform after 2015. The current usage metrics is available 48-96 hours after online publication and is updated daily on week days.
Initial download of the metrics may take a while.