Figure 8
Download original image
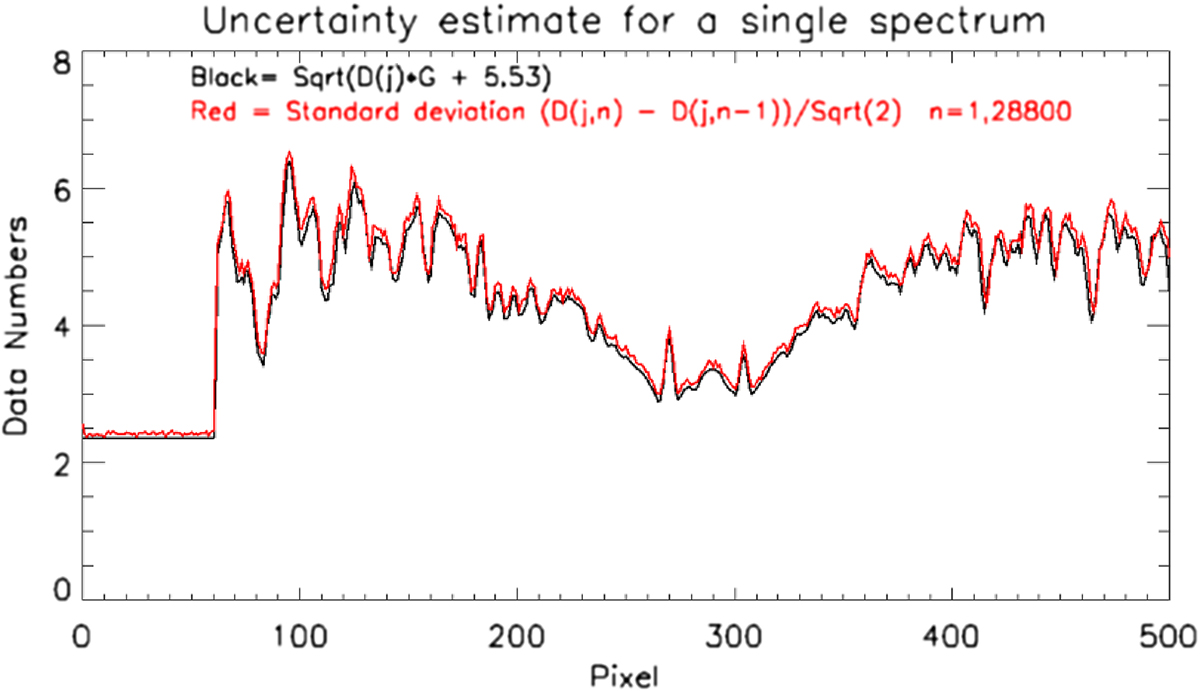
The black curve is an analytic uncertainty estimate for a single spectrum observed on February 19, 2017 and calculated from photon counting statistics, and detector read noise and digitization noise (Eq. (12)). The red curve is an estimate based on the differences of consecutive spectra obtained during the entire day. Uncertainties estimated from differencing spectra are 3% larger than those of the analytic calculation.
Current usage metrics show cumulative count of Article Views (full-text article views including HTML views, PDF and ePub downloads, according to the available data) and Abstracts Views on Vision4Press platform.
Data correspond to usage on the plateform after 2015. The current usage metrics is available 48-96 hours after online publication and is updated daily on week days.
Initial download of the metrics may take a while.