Figure 9
Download original image
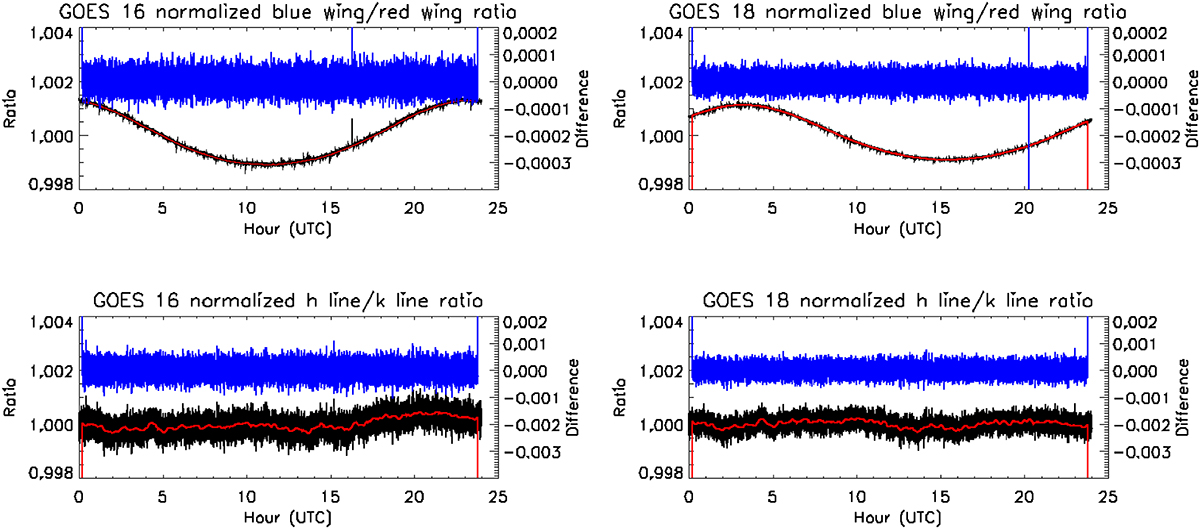
In the top panels (left abscissae), the black curves are plots of the normalized blue wing signal/red wing signal ratio observed by GOES-16 and GOES-18 EUVS-C On August 9, 2022. Red curves are 30-minute-long running averages that track the diurnal variation of the ratios. Blue curves (right abscissae) are black-red. Their standard deviations (σb/r = 3.1 × 10⁻⁵ and 2.4 × 10⁻⁵) for GOES-16 and GOES-18, respectively, are measures of the random error in the blue/red ratios after removal of diurnal trends. The bottom panels are plots of the h line/k line ratios (black) and 3-minute running means (red), along with the differences (blue). Their standard deviations are σh/k = 2.5 × 10⁻⁴ and 1.9 × 10⁻⁴. Values for both σb/r and σh/k are consistent with the errors calculated using equations (9), (11), and (17). Larger values for GOES-16 reflect its relatively larger loss of radiometric sensitivity with solar exposure (Sect. 4.2.4).
Current usage metrics show cumulative count of Article Views (full-text article views including HTML views, PDF and ePub downloads, according to the available data) and Abstracts Views on Vision4Press platform.
Data correspond to usage on the plateform after 2015. The current usage metrics is available 48-96 hours after online publication and is updated daily on week days.
Initial download of the metrics may take a while.