Figure 5
Download original image
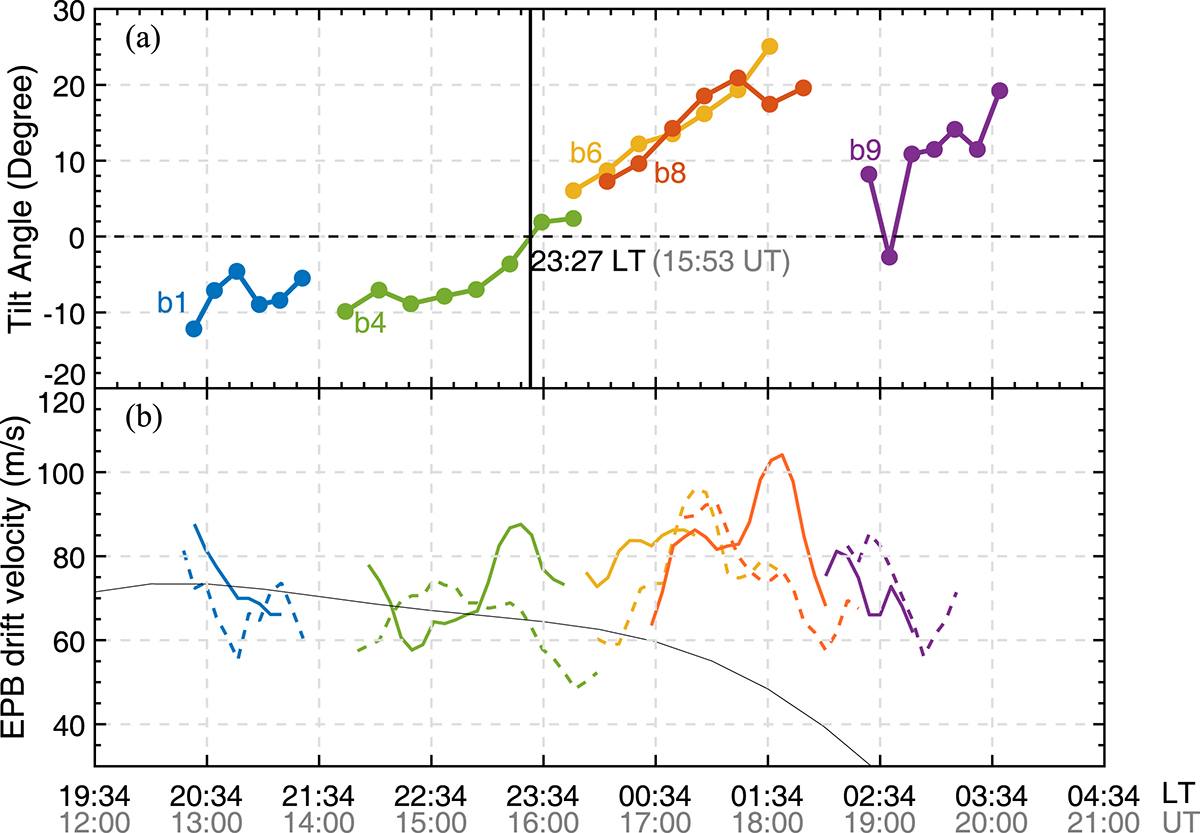
Variation in the tilt angles and drift velocities of the EPBs during the night of April 3, 2022 (eastward tilt is positive). (a) The values represent the tilt angles of the tilt lines marked in Figure 3 with respect to the meridian lines. The different colors of the lines in this figure correspond to the colors of the tilt lines in Figure 3. The vertical black line marks the time (23:27 LT, 15:53 UT on April 3, 2022) when the tilt directions of the EPBs changed from westward to eastward. (b) Variations in the EPB drift velocity and zonal wind velocity calculated via HWM14. The solid-colored lines represent the drift velocity of EPBs at 22°N. Dashed lines represent the drift velocity of EPBs at 20.5°N. The black curve is the zonal wind velocity calculated by HWM14 at Zhuhai station.
Current usage metrics show cumulative count of Article Views (full-text article views including HTML views, PDF and ePub downloads, according to the available data) and Abstracts Views on Vision4Press platform.
Data correspond to usage on the plateform after 2015. The current usage metrics is available 48-96 hours after online publication and is updated daily on week days.
Initial download of the metrics may take a while.