Figure 4
Download original image
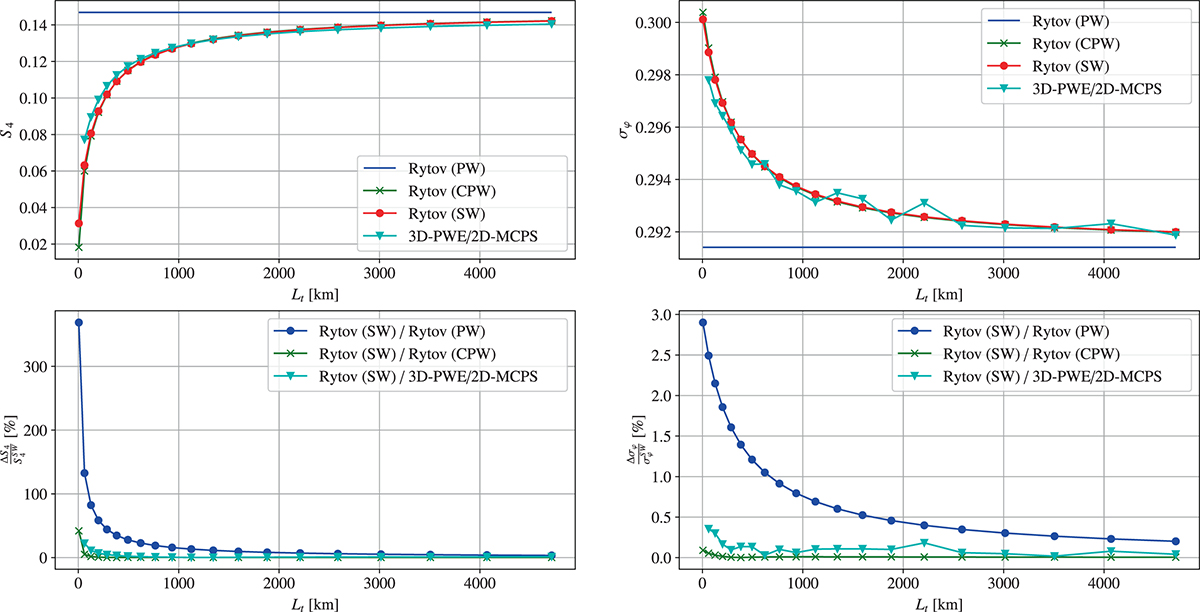
Top: Scintillation indices for an incident plane wave (blue curve), an incident spherical wave (red curve), an incident corrected plane wave (green curve) and PWE-MCPS result (cyan curve). Bottom: Relative error with respect to the incident spherical wave model. The satellite altitude varies between Hsat = H + ΔH = 370 km (on top of the ionospheric layer) and Hsat = 5,000 km.
Current usage metrics show cumulative count of Article Views (full-text article views including HTML views, PDF and ePub downloads, according to the available data) and Abstracts Views on Vision4Press platform.
Data correspond to usage on the plateform after 2015. The current usage metrics is available 48-96 hours after online publication and is updated daily on week days.
Initial download of the metrics may take a while.