Open Access
Figure 2
Download original image
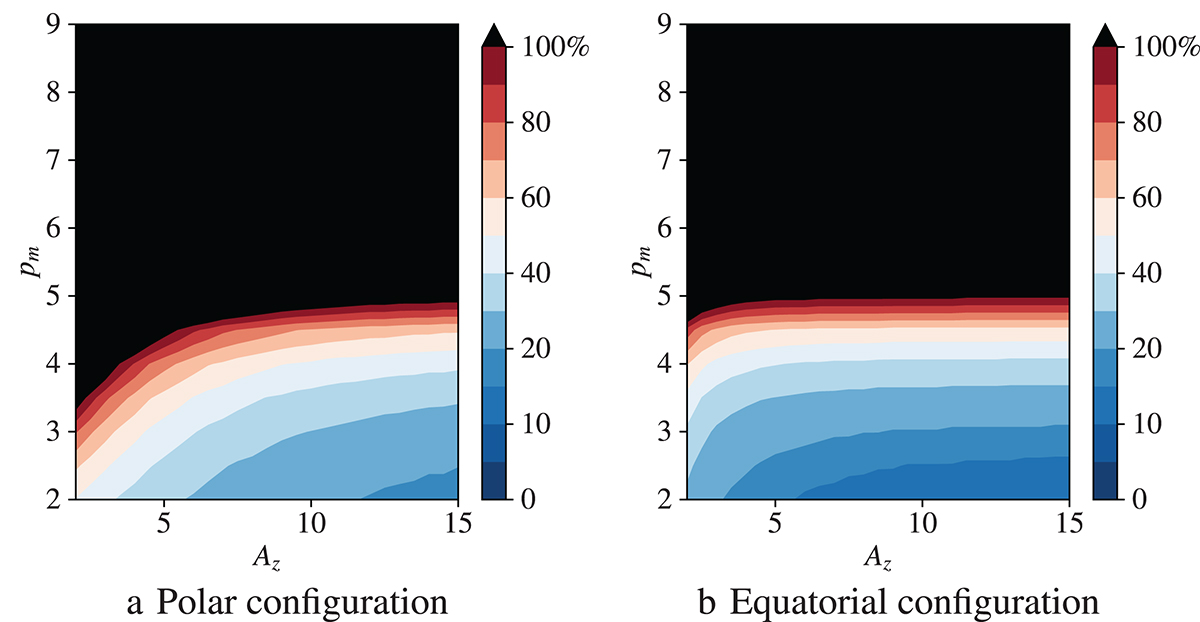
Relative error in percentage between the frequency of the maximum of the log-amplitude spectrum estimated numerically from (6) and the Fresnel frequency (18), ![]() , in color scale for both polar (a) and equatorial (b) configurations according to the anisotropic ratio Az and the slope of the irregularities PSD pm.
, in color scale for both polar (a) and equatorial (b) configurations according to the anisotropic ratio Az and the slope of the irregularities PSD pm.
Current usage metrics show cumulative count of Article Views (full-text article views including HTML views, PDF and ePub downloads, according to the available data) and Abstracts Views on Vision4Press platform.
Data correspond to usage on the plateform after 2015. The current usage metrics is available 48-96 hours after online publication and is updated daily on week days.
Initial download of the metrics may take a while.