Figure 2
Download original image
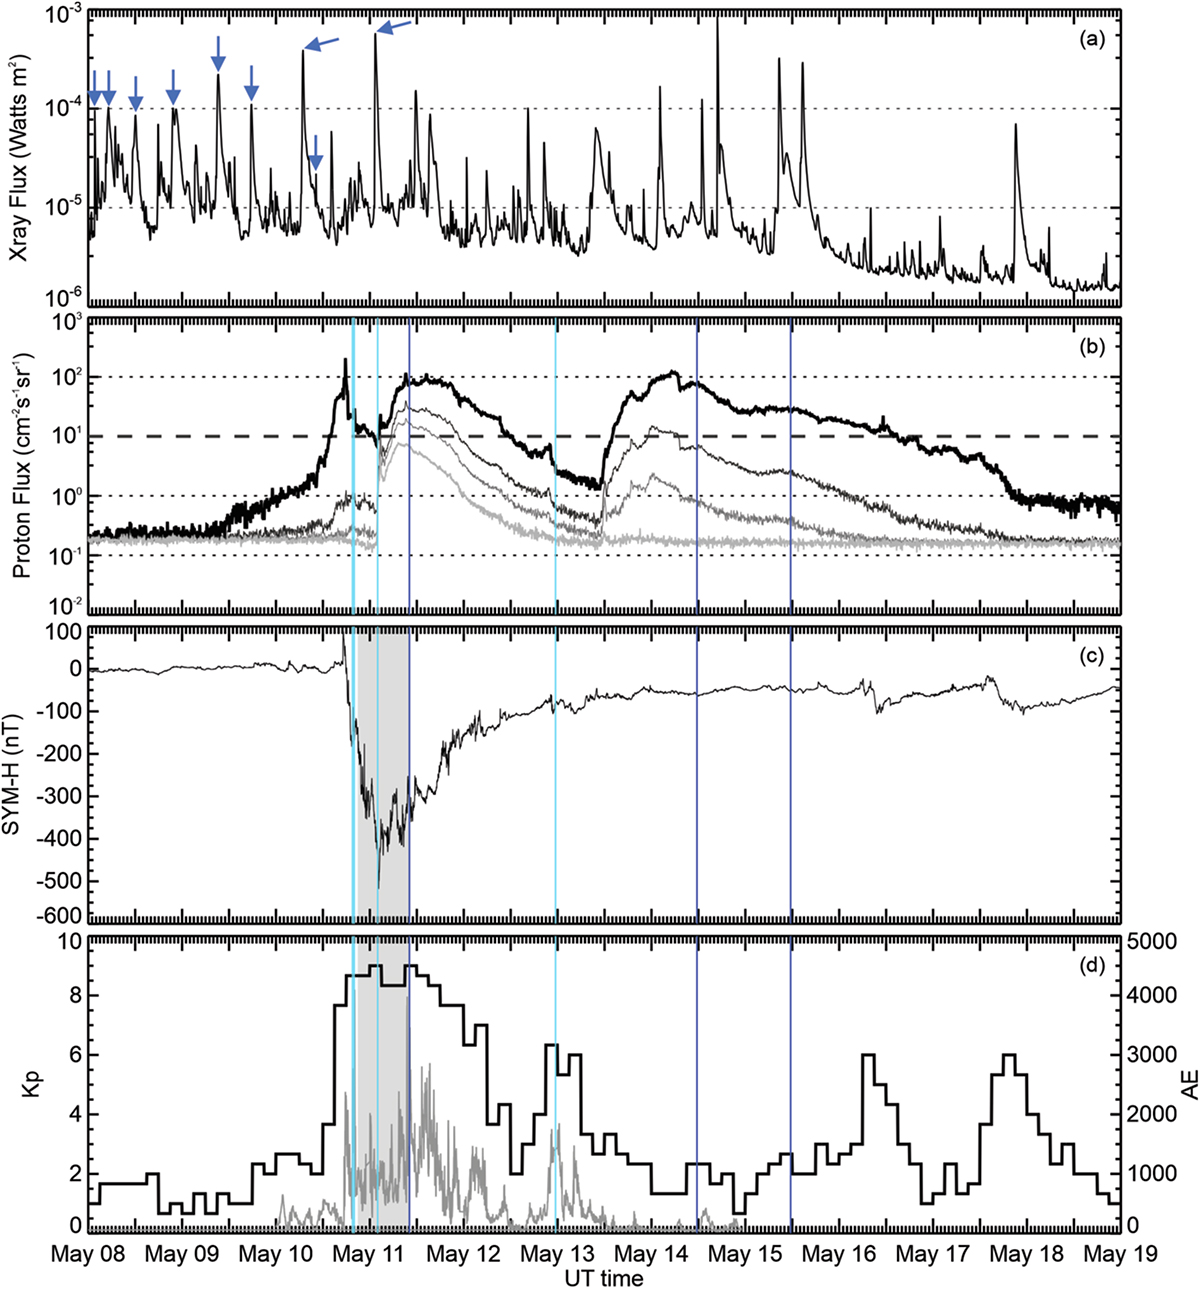
(a) GOES 18 solar X-ray flux. Horizontal lines at 10−5 Wm2 and 10−4 Wm2 indicate thresholds for M-class and X-class flares, respectively. Blue arrows indicate CMEs considered in the event forecasting. (b) GOES 18 solar proton flux in the >10 MeV (thick black line), >30 MeV (thin black line), >50 MeV (thin dark grey line), and >100 MeV (thick light grey line) channels. Horizontal dashed line indicates the 10 cm−2s−1sr−1 typically used to indicate the onset of a solar proton event based on the >10 MeV solar proton flux. (c) SYM-H index. (d) Kp index (heavy black line) and AE index (grey line). All data are for 08-19 May 2024. Vertical lines in (b), (c), and (d) indicate times of HF COM (dark blue) and GNSS (light blue) degradation reported in CADORS reports (see Sect. 5). Grey shading in panels (c) and (d) indicates an outage of the Wide Area Augmentation System (WAAS; see Sect. 5).
Current usage metrics show cumulative count of Article Views (full-text article views including HTML views, PDF and ePub downloads, according to the available data) and Abstracts Views on Vision4Press platform.
Data correspond to usage on the plateform after 2015. The current usage metrics is available 48-96 hours after online publication and is updated daily on week days.
Initial download of the metrics may take a while.