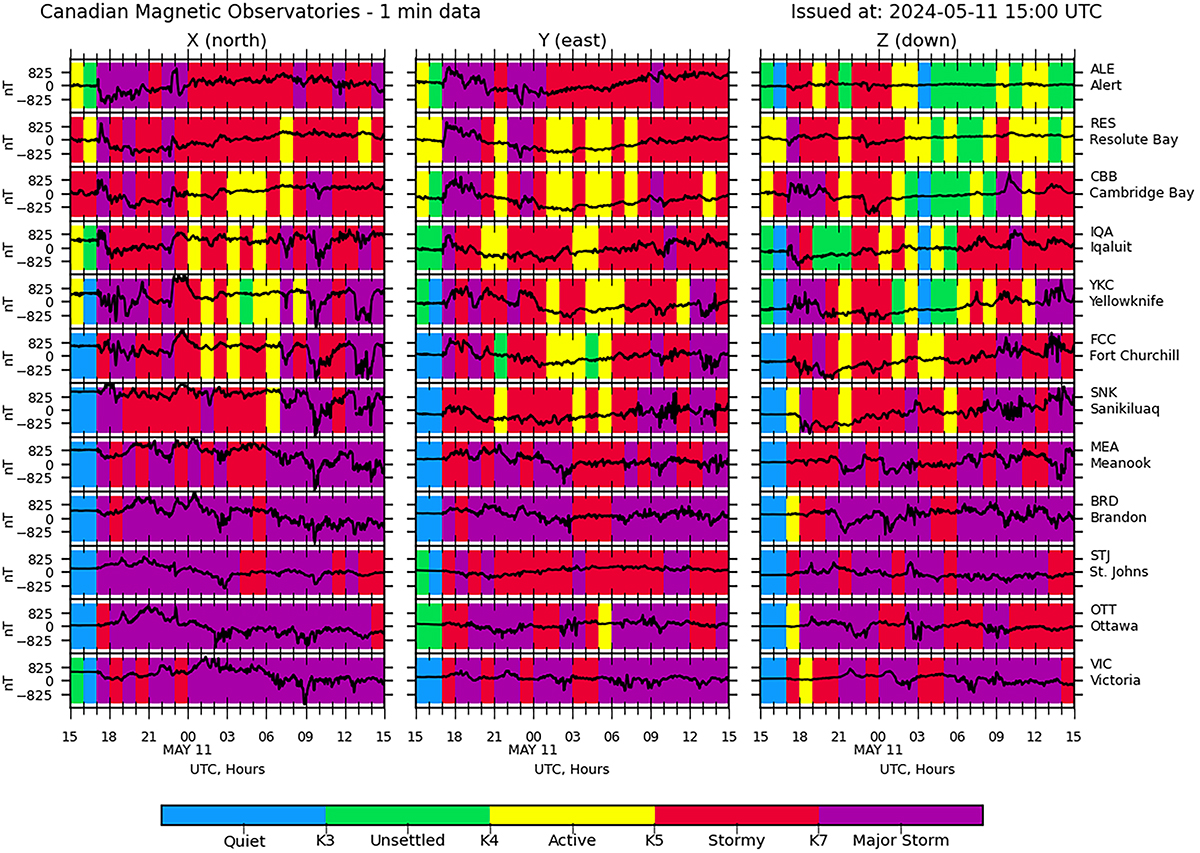
Figure 4
Download original image
Review plot of magnetic field variations (black line) for the previous 24 h issued 11 May 2024 at 15:00 UT by the CSWFC. The black line represents one-minute variations of the X, Y and Z magnetic field components for NRCan’s geomagnetic observatories. The observatories are ordered according to their geographic latitude, from the north (top) to the south (bottom). Color denotes geomagnetic activity characterized by the hourly range of magnetic field variations. The plot captures the start of the storm on May 10 at 17–18 UT and the most intense part of the storm during May 10–11, including significant X component field variations around 9–10 UT on May 11. Geomagnetic activity colour is coded according to the colour bar at the bottom of the Figure which also denotes NRCan’s activity level descriptors (“Quiet”, “Unsettled”, “Active”, “Stormy”, “Major Storm”) and roughly equivalent K values.
Current usage metrics show cumulative count of Article Views (full-text article views including HTML views, PDF and ePub downloads, according to the available data) and Abstracts Views on Vision4Press platform.
Data correspond to usage on the plateform after 2015. The current usage metrics is available 48-96 hours after online publication and is updated daily on week days.
Initial download of the metrics may take a while.