Figure 6
Download original image
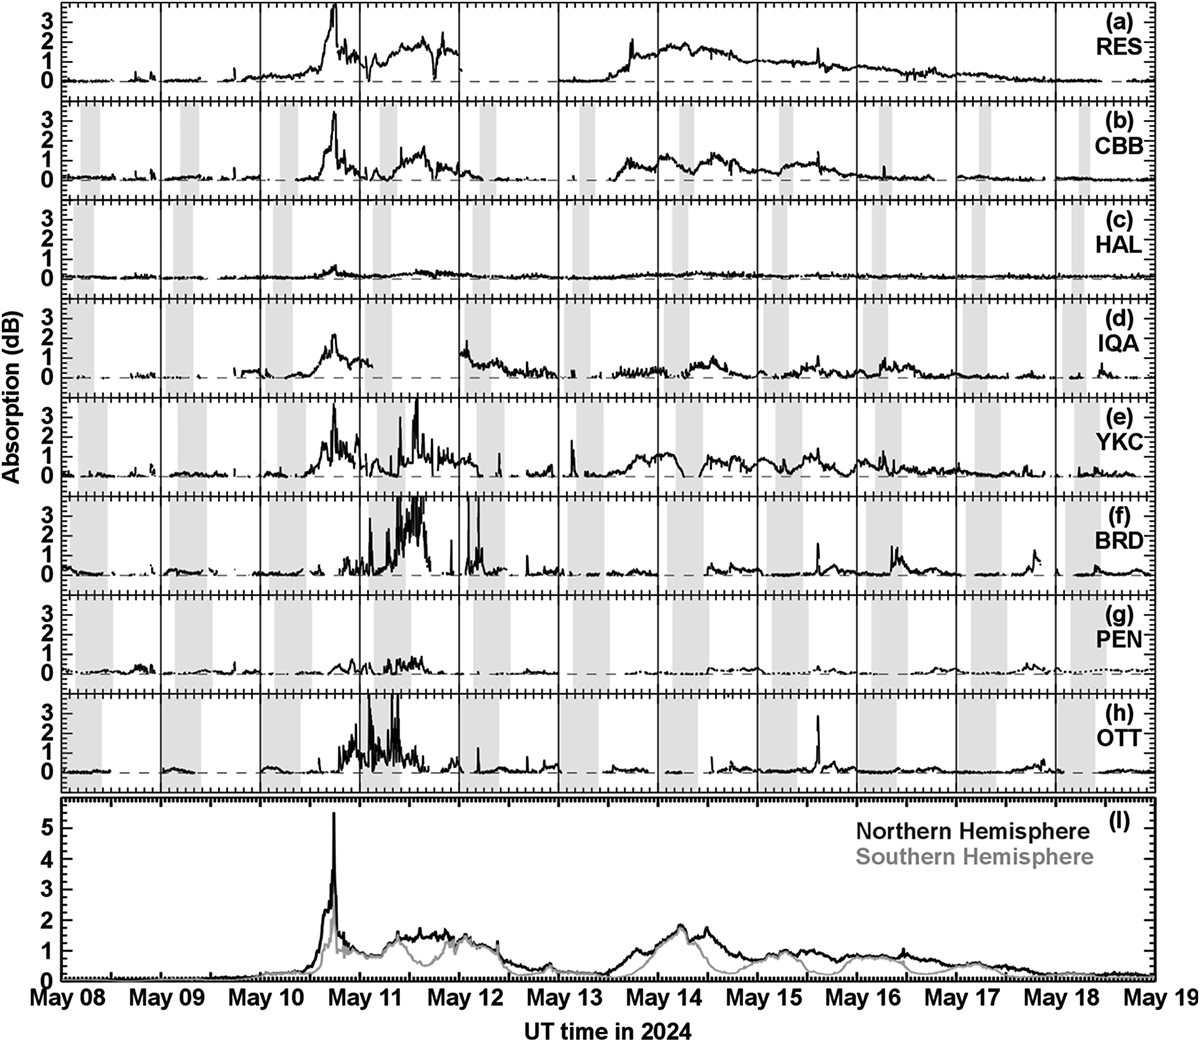
(a–h) Absorption at 30 MHz derived from the NRCan riometer array for 08–18 May 2024. Data have been downsampled to a 1-minute median value. Stations are ordered by descending geographic latitude (see Table 1) according to the station label in the upper right portion of the panel. Grey shading indicates when the station was located on the nightside. (i) Maximum northern hemisphere (black) and southern hemisphere (grey) polar cap absorption at 30 MHz modelled using the Fiori & Danskin (2016) “non-optimized” model at 5-minute increments.
Current usage metrics show cumulative count of Article Views (full-text article views including HTML views, PDF and ePub downloads, according to the available data) and Abstracts Views on Vision4Press platform.
Data correspond to usage on the plateform after 2015. The current usage metrics is available 48-96 hours after online publication and is updated daily on week days.
Initial download of the metrics may take a while.