Figure 10
Download original image
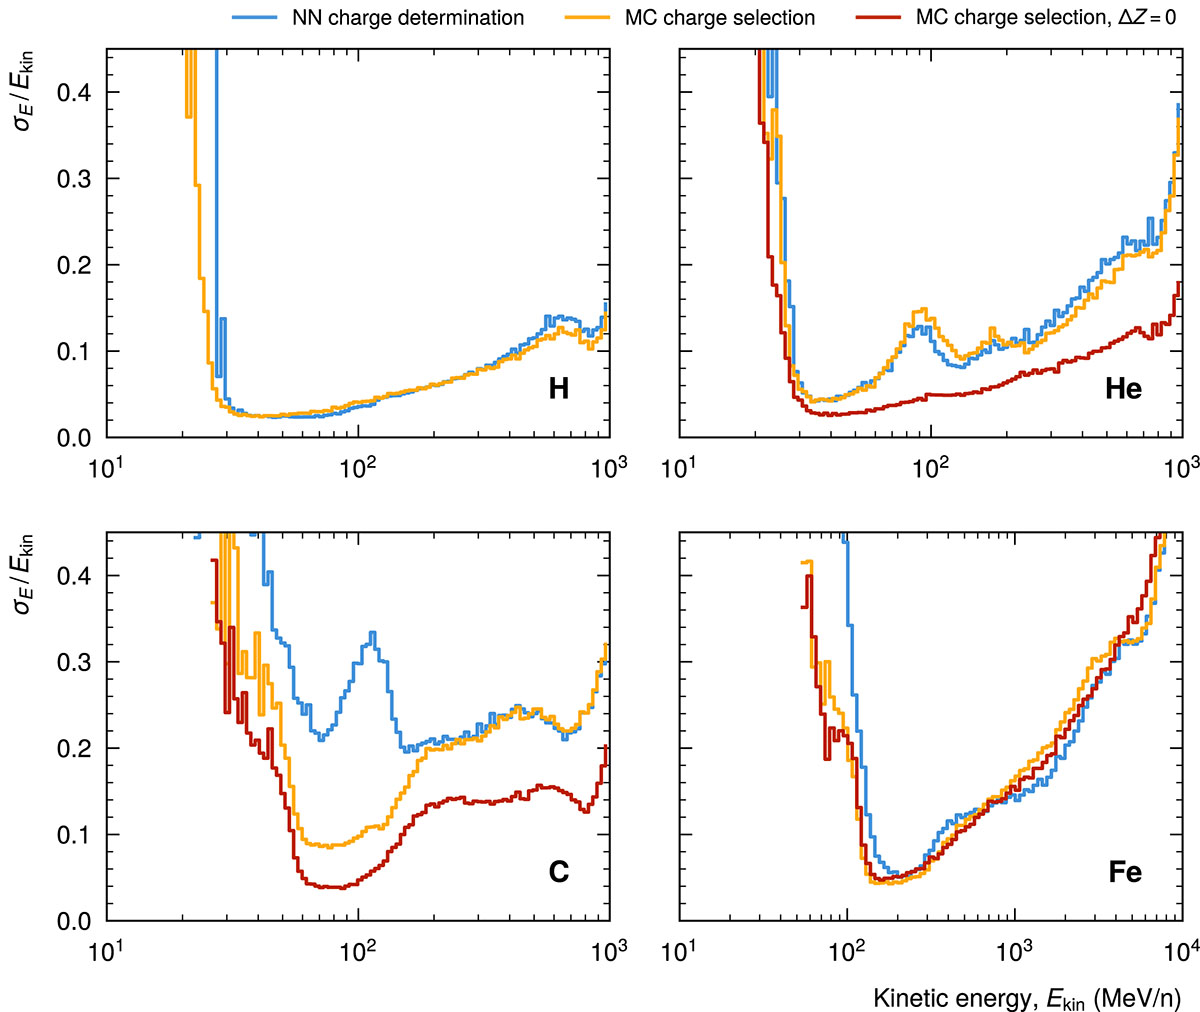
Energy resolution for hydrogen (H), helium (He), carbon (C), and iron (Fe) nuclei with energies from 20 MeV/n to 1 GeV/n (10 GeV/n for iron). The yellow histograms show the performance for testing events of the target charge which we selected based on knowledge from the simulation (Zmc = Ztarget), the blue ones the result for particles that were selected by our charge-determination network from a test data set containing all elements up to cobalt (Zrec = Ztarget). For helium and carbon, we trained the networks with nuclei in the range [Z − 1, Z + 1] of the target charge and the one for iron in the range Z ∈ [24, 28]. The network for hydrogen was always trained for the target charge only. The red histograms show the performance for networks trained only with the target charge determined from the simulation (∆Zmc = 0).
Current usage metrics show cumulative count of Article Views (full-text article views including HTML views, PDF and ePub downloads, according to the available data) and Abstracts Views on Vision4Press platform.
Data correspond to usage on the plateform after 2015. The current usage metrics is available 48-96 hours after online publication and is updated daily on week days.
Initial download of the metrics may take a while.