Open Access
Figure 2
Download original image
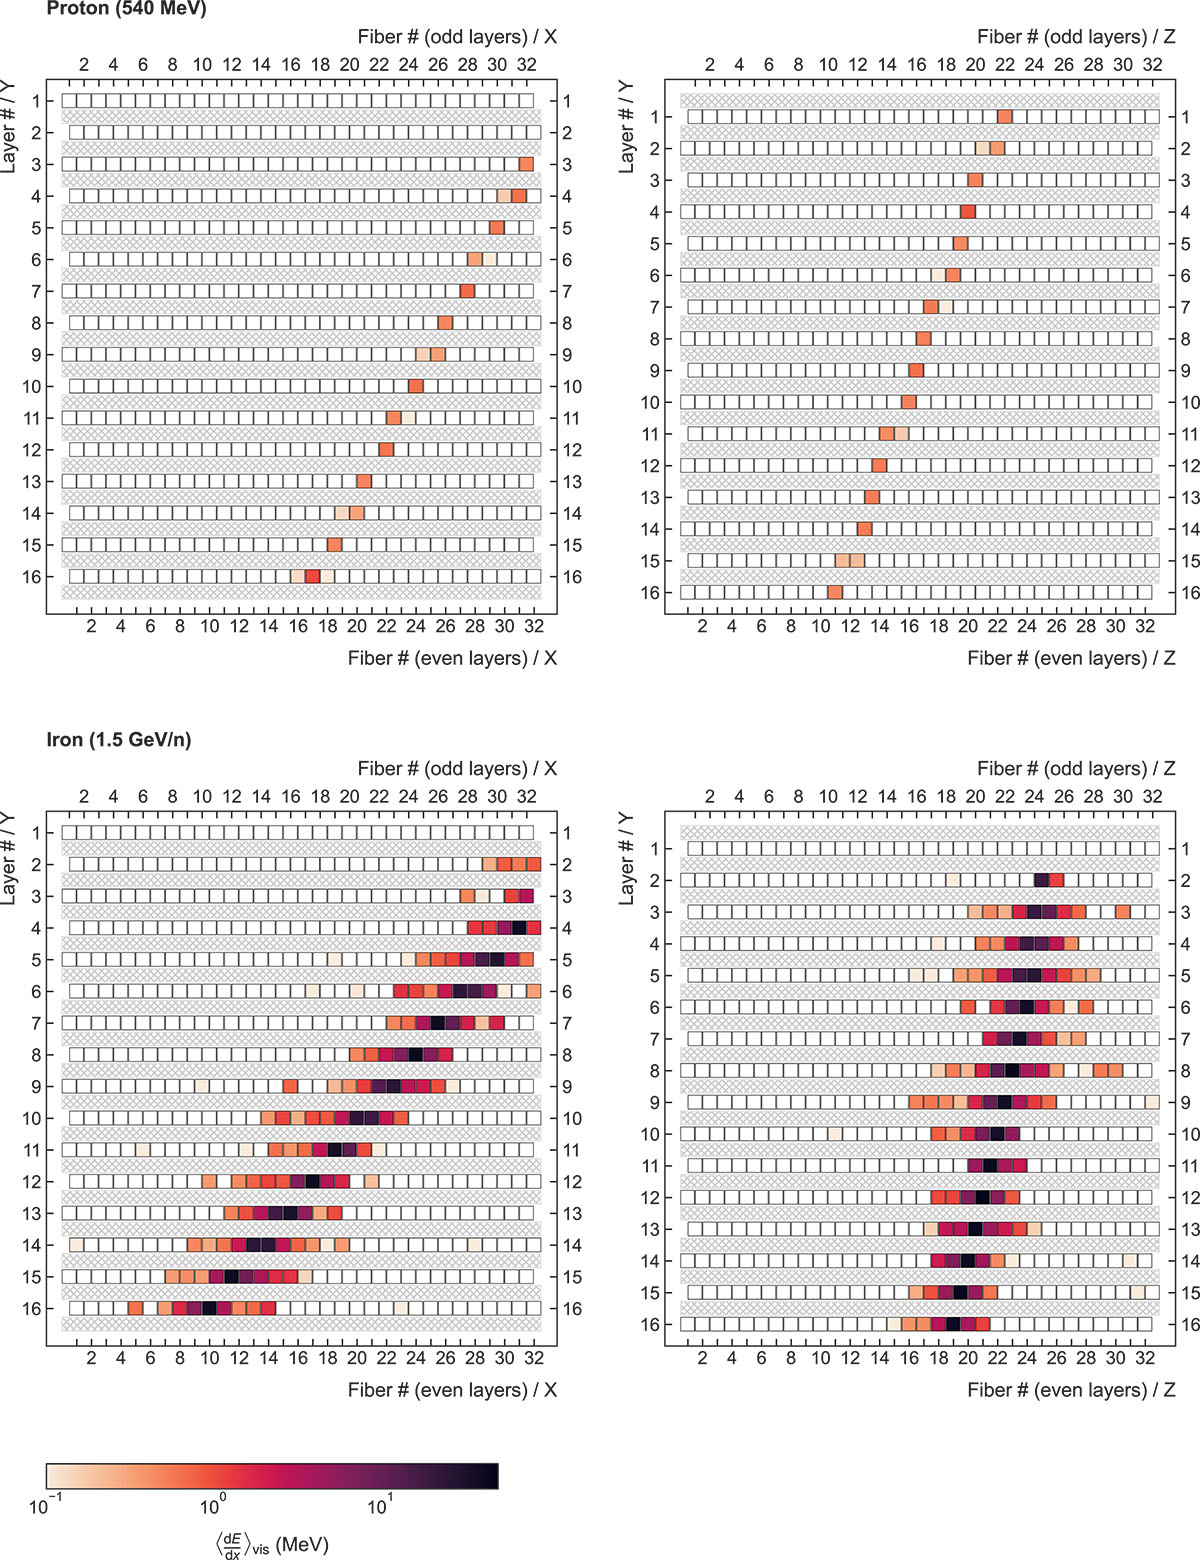
Simulated event signatures of a 540-MeV proton (top) and a 1.5-GeV/n iron nucleus (bottom), shown in the yx- (left) and yz-projections (right) illustrated in Figure 1. The color indicates how much energy is converted into scintillation light in each fiber.
Current usage metrics show cumulative count of Article Views (full-text article views including HTML views, PDF and ePub downloads, according to the available data) and Abstracts Views on Vision4Press platform.
Data correspond to usage on the plateform after 2015. The current usage metrics is available 48-96 hours after online publication and is updated daily on week days.
Initial download of the metrics may take a while.