Figure 5
Download original image
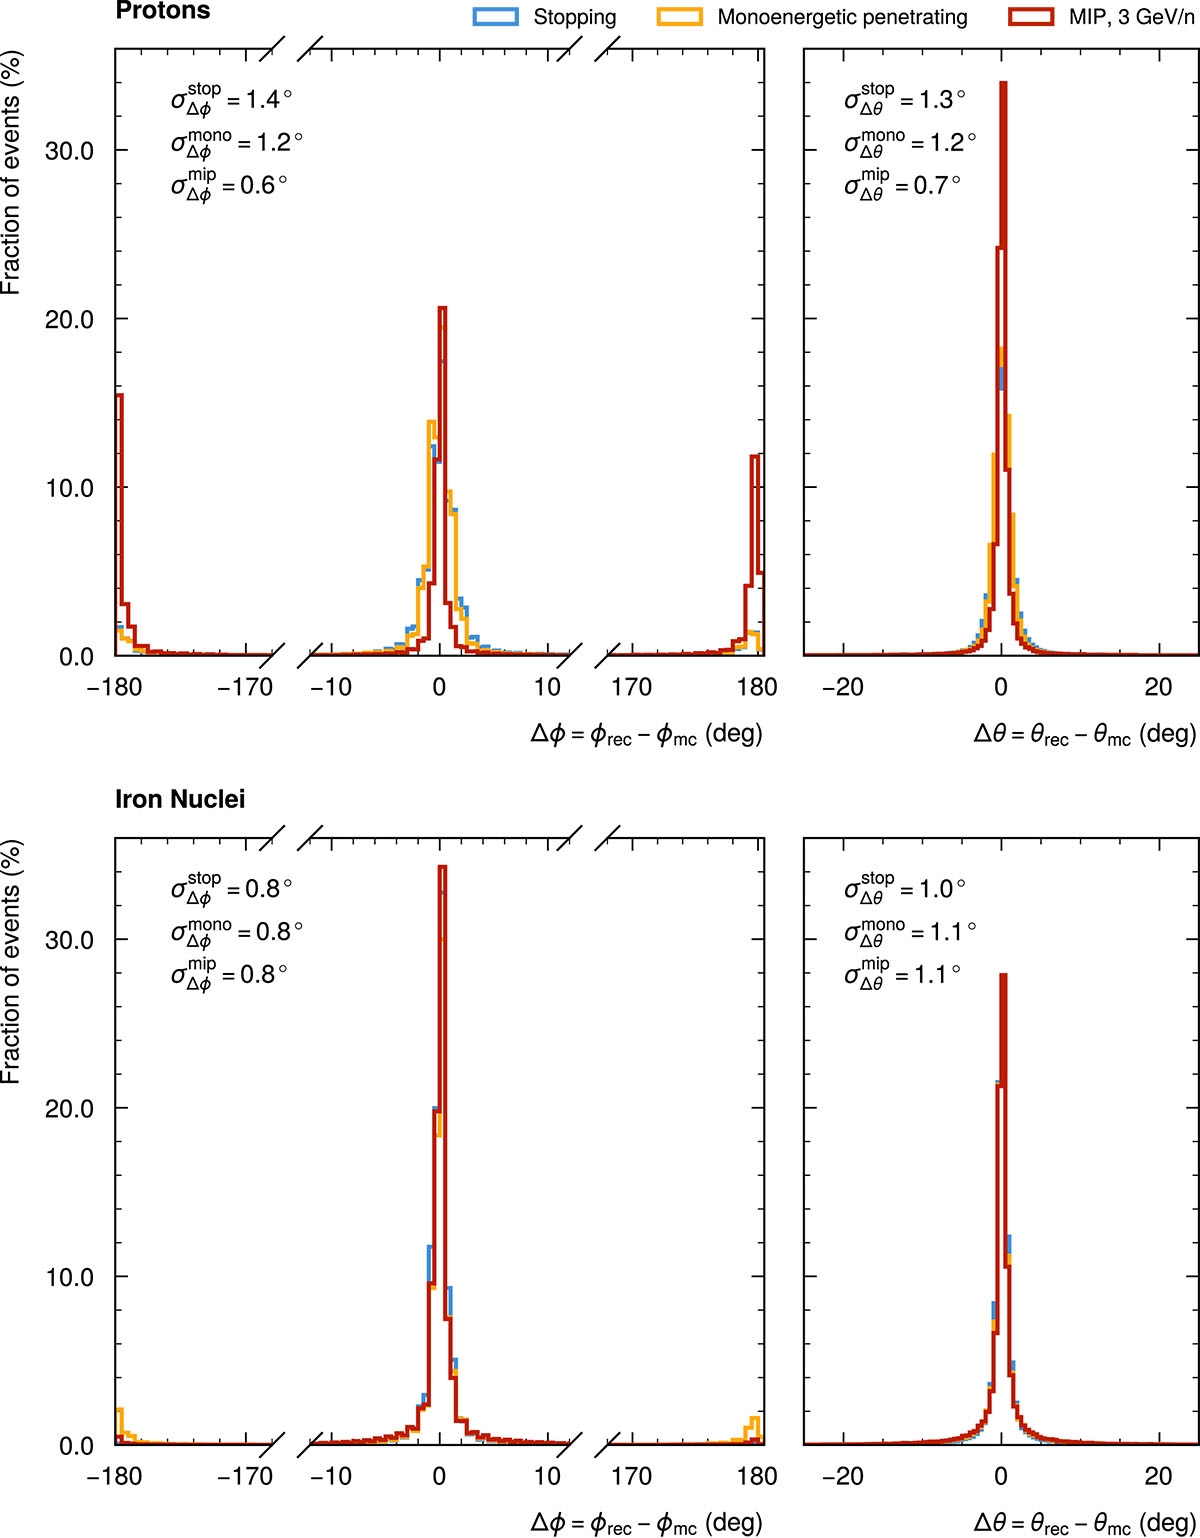
Reconstruction performance for the track angles ϕ (left) and θ (right) for protons and for iron nuclei, shown as the differences (∆ϕ and ∆θ) between the reconstructed angles (θrec and ϕrec) and the true angles (θmc and ϕmc). The blue histograms show the performance using networks trained to reconstruct the tracks of stopping particles. The yellow histograms show the corresponding results for monoenergetic particles (120 MeV for protons and 500 MeV/n for iron), the red histograms for minimum-ionizing particles with an energy of 3 GeV/n. For each case, we quote the σ of the direction-independent ∆ϕ and ∆θ distributions.
Current usage metrics show cumulative count of Article Views (full-text article views including HTML views, PDF and ePub downloads, according to the available data) and Abstracts Views on Vision4Press platform.
Data correspond to usage on the plateform after 2015. The current usage metrics is available 48-96 hours after online publication and is updated daily on week days.
Initial download of the metrics may take a while.