Figure 6
Download original image
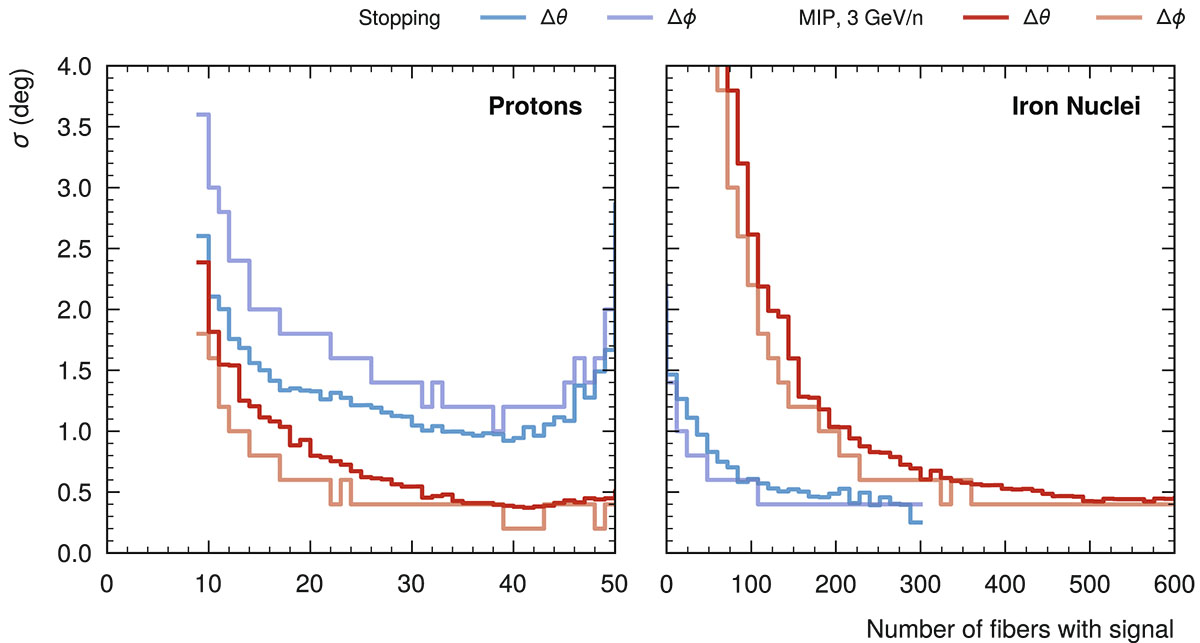
Dependence of σ on the number of fibers with signal per event for stopping particles (blue) and minimum-ionizing particles (red). Values of σ∆ϕ are multiples of the output resolution of the network (0.2°); σ∆θ is calculated from ϕ and θproj. The number of fibers with signal can be larger than the depth of the ADU (32 fibers/layers) due to the emission of secondary particles (see Fig. 2).
Current usage metrics show cumulative count of Article Views (full-text article views including HTML views, PDF and ePub downloads, according to the available data) and Abstracts Views on Vision4Press platform.
Data correspond to usage on the plateform after 2015. The current usage metrics is available 48-96 hours after online publication and is updated daily on week days.
Initial download of the metrics may take a while.