Figure 8
Download original image
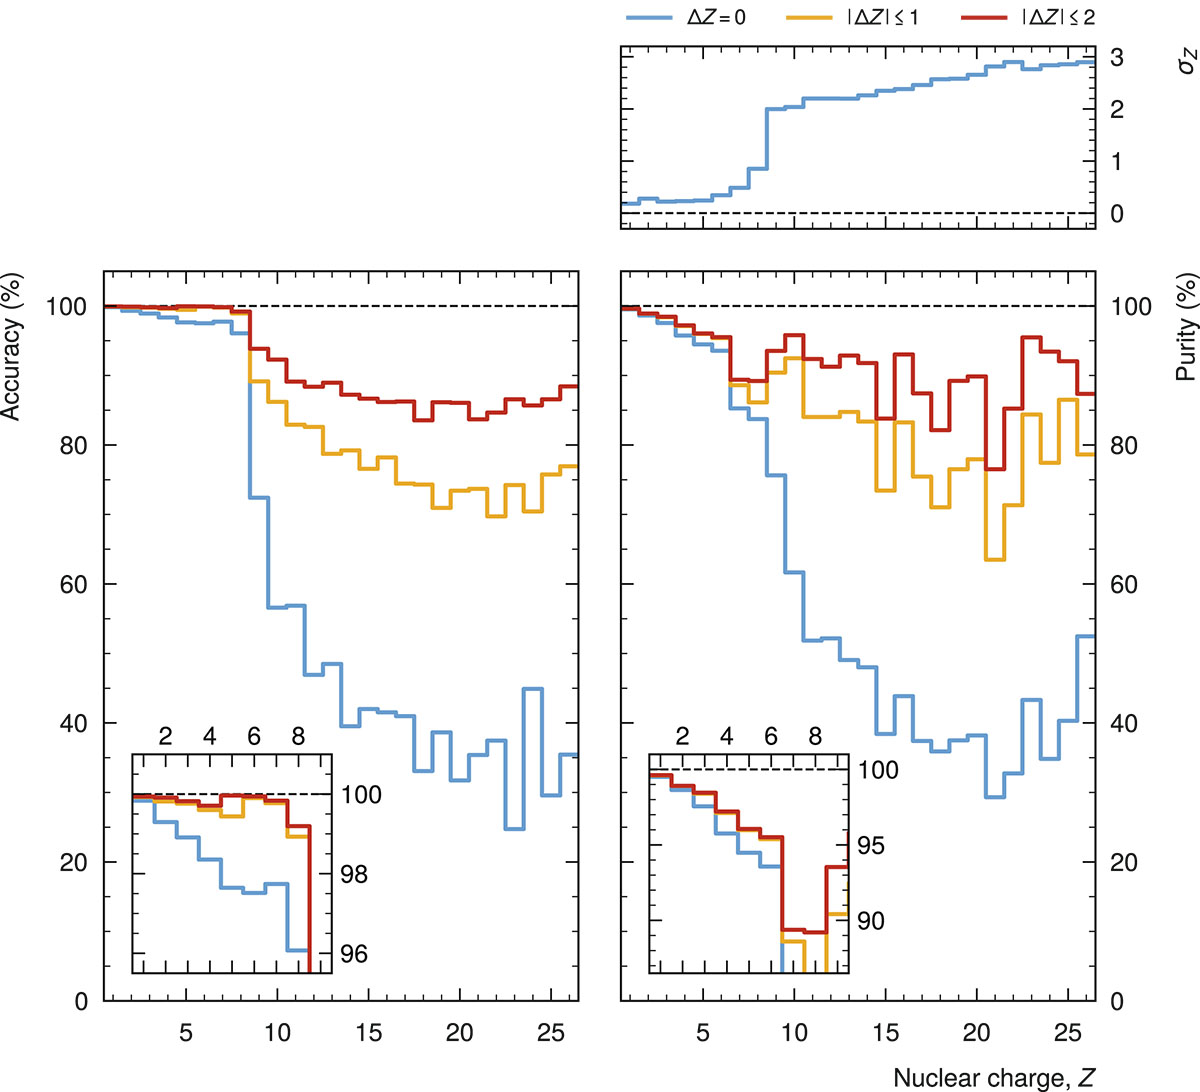
The accuracy (left panel) and purity (bottom right panel) of the charge determination as a function of Z. We define the accuracy as the fraction of correctly identified events for a given Zmc and the purity as the fraction of events in a Zrec class for which Zrec = Zmc. The top right panel shows the standard deviation, σZ, of the reconstructed-charge distributions (the columns in Fig. 7). The blue curves show the performance for an exact identification of the charge (∆Z = Zrec−Zmc = 0). The yellow and red curves illustrate the improvement when we allow |∆Z| ≤ 1 and |∆Z| ≤ 2, respectively. The insets in the lower panels provide zoomed-in views for Z ≤ 8.
Current usage metrics show cumulative count of Article Views (full-text article views including HTML views, PDF and ePub downloads, according to the available data) and Abstracts Views on Vision4Press platform.
Data correspond to usage on the plateform after 2015. The current usage metrics is available 48-96 hours after online publication and is updated daily on week days.
Initial download of the metrics may take a while.