Figure S3:
Download original image
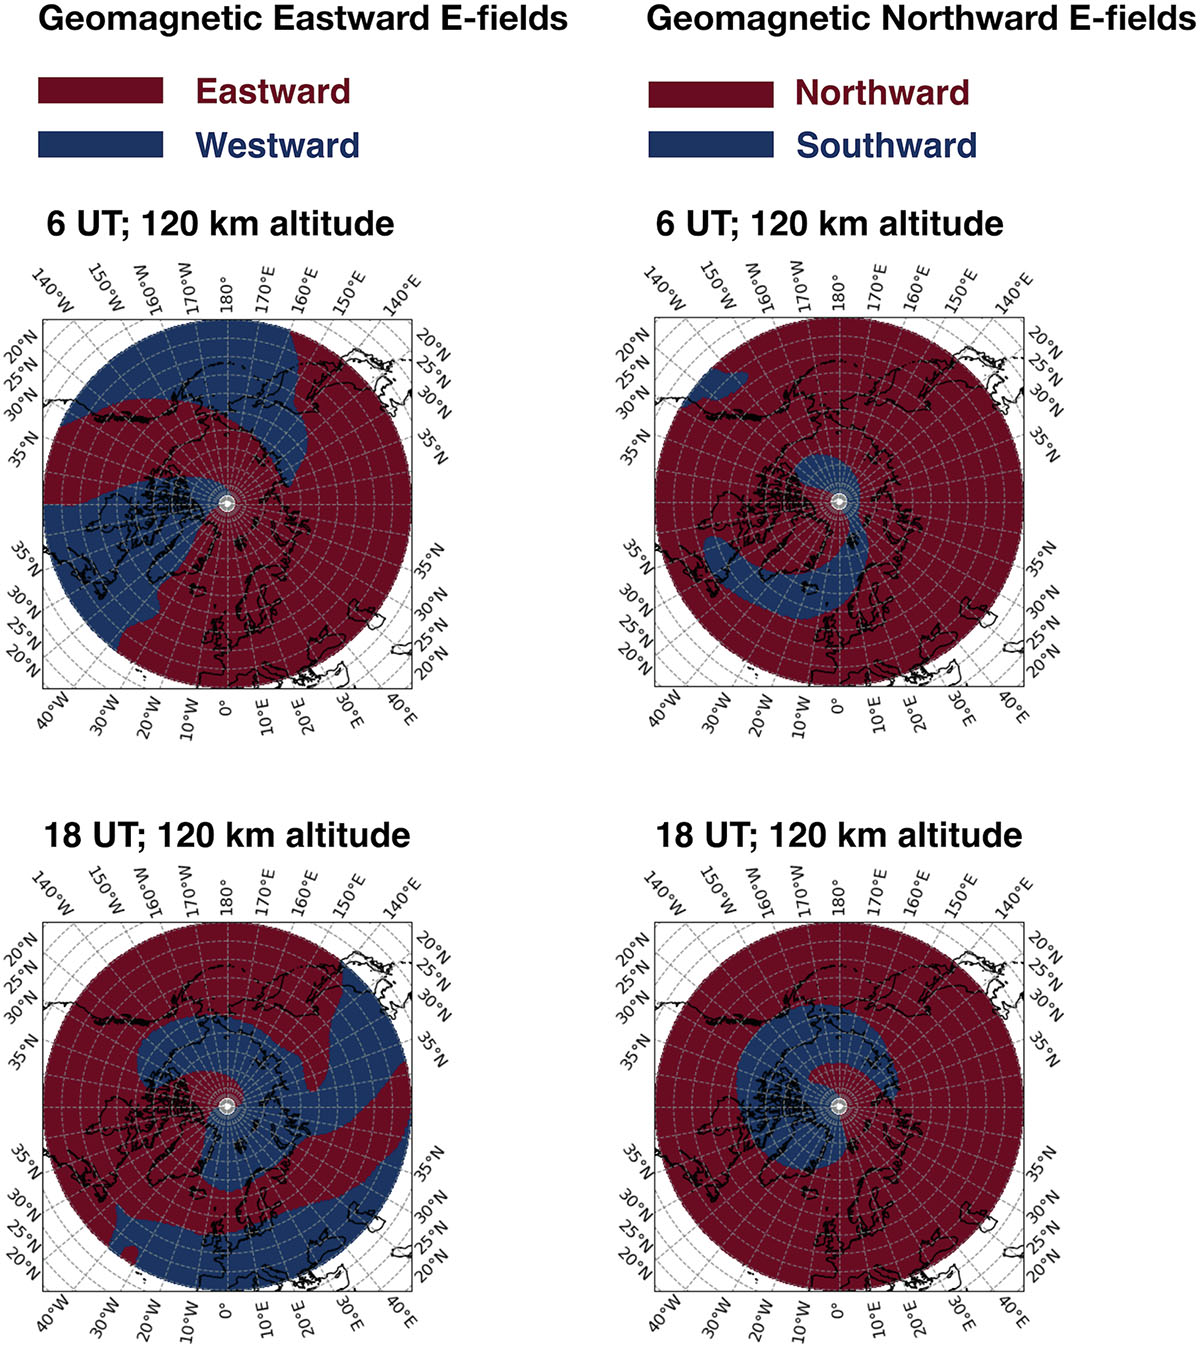
Directions of geomagnetic electric fields in the simulation at 120 km altitude and (upper plots) 6 UT and (lower plots) 18 UT. The left and right columns show directions of geomagnetic eastward and northward electric fields, respectively. Red and blue regions indicate eastward and westward (northward and southward) in the left column (right column).
Current usage metrics show cumulative count of Article Views (full-text article views including HTML views, PDF and ePub downloads, according to the available data) and Abstracts Views on Vision4Press platform.
Data correspond to usage on the plateform after 2015. The current usage metrics is available 48-96 hours after online publication and is updated daily on week days.
Initial download of the metrics may take a while.