Figure 8
Download original image
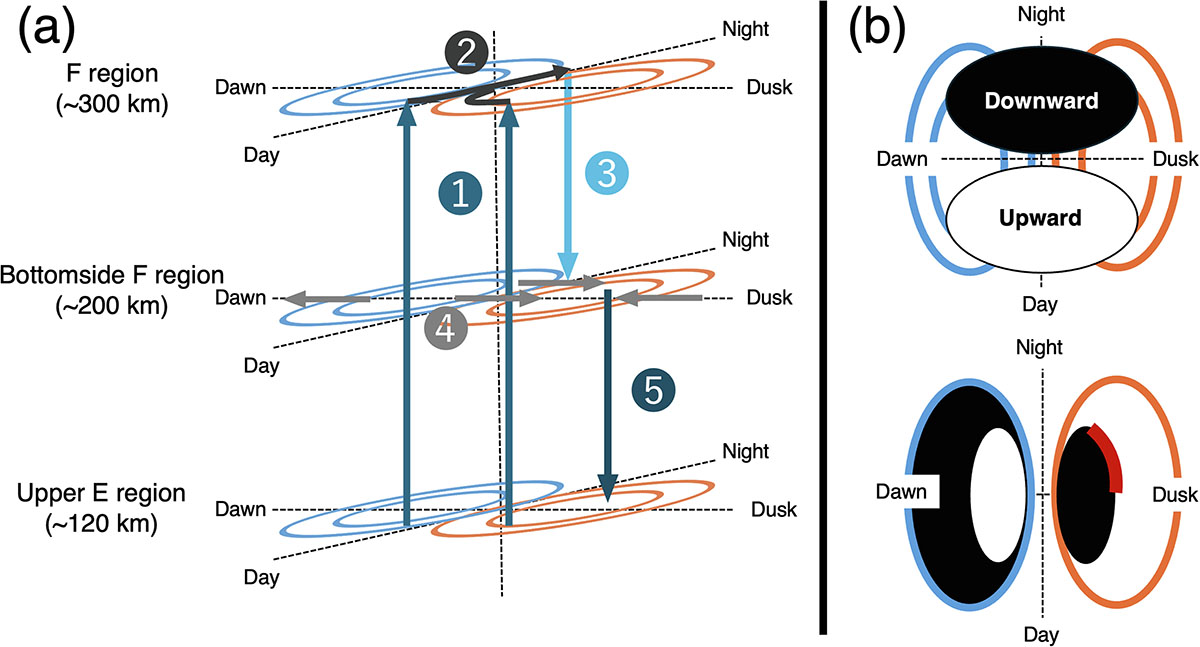
Schematic figures of (a) the three-dimensional metal ion flow in the polar ionosphere and (b) the vertical ion movements in the E × B (top plot) and Pedersen (bottom plot) directions. Blue and orange ellipses represent morning and evening cells of electric fields, respectively. The red line in the bottom plot of Figure 8b indicates the region where metal ions can accumulate in the ionospheric E region.
Current usage metrics show cumulative count of Article Views (full-text article views including HTML views, PDF and ePub downloads, according to the available data) and Abstracts Views on Vision4Press platform.
Data correspond to usage on the plateform after 2015. The current usage metrics is available 48-96 hours after online publication and is updated daily on week days.
Initial download of the metrics may take a while.