Open Access
Fig. 10.
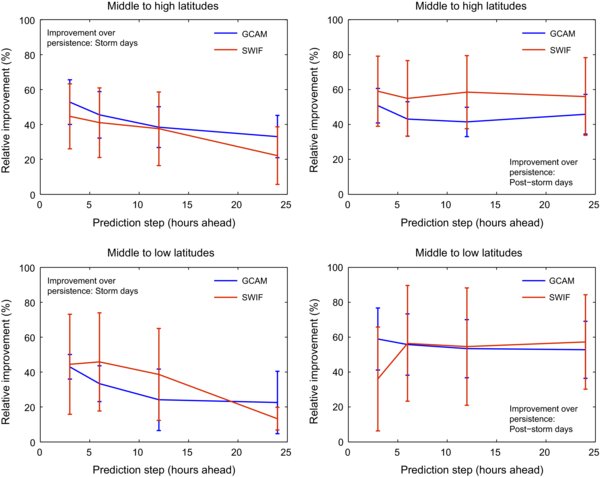
Download original image
The improvement over persistence (Per-24) for GCAM and SWIF separately for middle-to-high (top) and middle-to-low (bottom) latitudes and storm (left) and post-storm days (right) in respect to the prediction step. Error bars denote standard deviations from the mean.
Current usage metrics show cumulative count of Article Views (full-text article views including HTML views, PDF and ePub downloads, according to the available data) and Abstracts Views on Vision4Press platform.
Data correspond to usage on the plateform after 2015. The current usage metrics is available 48-96 hours after online publication and is updated daily on week days.
Initial download of the metrics may take a while.