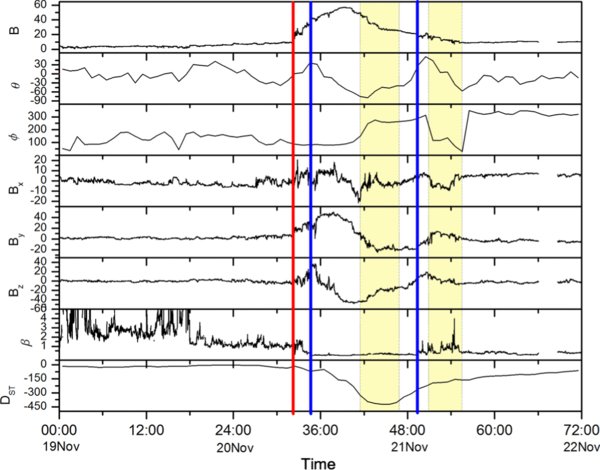
Fig. 2.
Download original image
A plot of interplanetary magnetic field parameters from 19 to 22 November 2003. From top to bottom are plotted the magnetic field strength (B), the elevation (θ) and azimuth (ϕ) of the magnetic field direction, three-dimensional magnetic field components (Bx, By, Bz), plasma beta obtained from Wind spacecraft and 1-h averaged Dst index. Red line indicates the shock while the region between blue lines is magnetic cloud. Time is plotted in hours starting from 19 November, 00:00 h.
Current usage metrics show cumulative count of Article Views (full-text article views including HTML views, PDF and ePub downloads, according to the available data) and Abstracts Views on Vision4Press platform.
Data correspond to usage on the plateform after 2015. The current usage metrics is available 48-96 hours after online publication and is updated daily on week days.
Initial download of the metrics may take a while.