Fig. 3.
Download original image
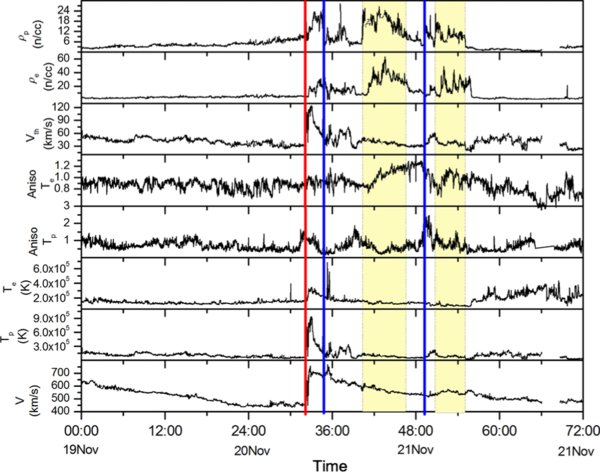
Measurements of proton density (ρp), electron density (ρe), proton thermal velocity (Vth), electron temperature anisotropy, proton temperature anisotropy, electron temperature (Te), proton temperature (Tp) and solar wind bulk velocity (V) obtained from Wind spacecraft. Red line indicates the shock while the region between blue lines is magnetic cloud. The yellow-shaded region is filament plasma, indicated by high density (proton and electron) and low temperatures.
Current usage metrics show cumulative count of Article Views (full-text article views including HTML views, PDF and ePub downloads, according to the available data) and Abstracts Views on Vision4Press platform.
Data correspond to usage on the plateform after 2015. The current usage metrics is available 48-96 hours after online publication and is updated daily on week days.
Initial download of the metrics may take a while.