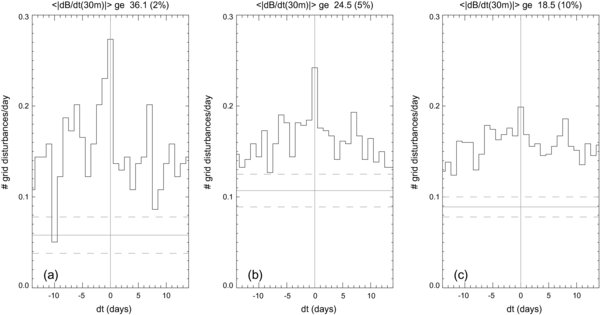
Fig. 2.
Download original image
Superposed epoch statistics of US power-grid disturbances for days of geomagnetic activity as measured by the maximum dB/dt in 30-min intervals, averaged for the US BOU and FRD stations (〈|dB/dt(30 m)|〉) for the top 2, 5, and 10% of dates between 1992 and 2010, respectively. In each panel, the horizontal gray line and the dashed lines adjacent to it show the disturbance rates under quiescent space-weather conditions (i.e., the values of gi, see Sect. 3 and Table 1) and the associated standard deviations, respectively.
Current usage metrics show cumulative count of Article Views (full-text article views including HTML views, PDF and ePub downloads, according to the available data) and Abstracts Views on Vision4Press platform.
Data correspond to usage on the plateform after 2015. The current usage metrics is available 48-96 hours after online publication and is updated daily on week days.
Initial download of the metrics may take a while.