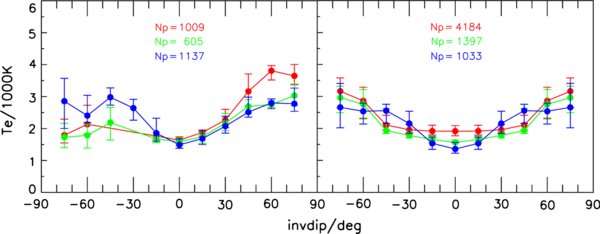
Fig. 5.
Download original image
Equinox (left) and solstice (right) noontime electron temperatures versus invdip latitude at 550 km for three levels of solar activity (blue, low, PF10.7 < 110; green, medium, 110 < PF10.7 < 180; red, high, PF10.7 > 180). Data shown are from satellite in situ measurements giving the median plus upper and lower quartiles. Np is total number of measurements for each curve.
Current usage metrics show cumulative count of Article Views (full-text article views including HTML views, PDF and ePub downloads, according to the available data) and Abstracts Views on Vision4Press platform.
Data correspond to usage on the plateform after 2015. The current usage metrics is available 48-96 hours after online publication and is updated daily on week days.
Initial download of the metrics may take a while.