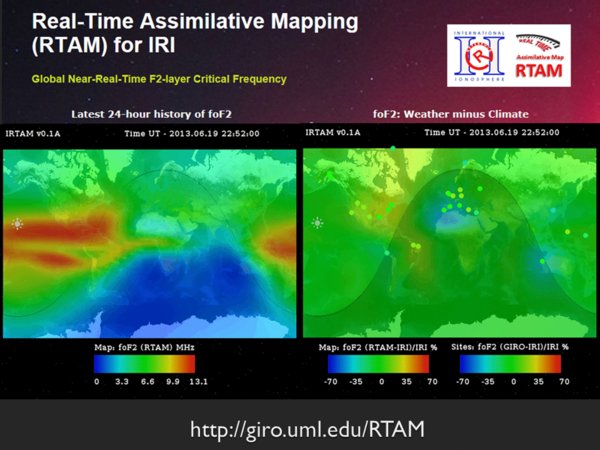
Fig. 7.
Download original image
World maps of plasma frequency foF2 obtained with IRI RTAM by assimilating data from the Global Ionospheric Radio Observatory (GIRO) into the IRI model for foF2. The left panel shows the final map. The right panel shows the GIRO digisonde stations (circles) that contributed and the color in the circle percentage difference between IRI and the GIRO measurements. The color in the rest of the right panel shows the percentage difference between RTAM and IRI.
Current usage metrics show cumulative count of Article Views (full-text article views including HTML views, PDF and ePub downloads, according to the available data) and Abstracts Views on Vision4Press platform.
Data correspond to usage on the plateform after 2015. The current usage metrics is available 48-96 hours after online publication and is updated daily on week days.
Initial download of the metrics may take a while.