Fig. 10.
Download original image
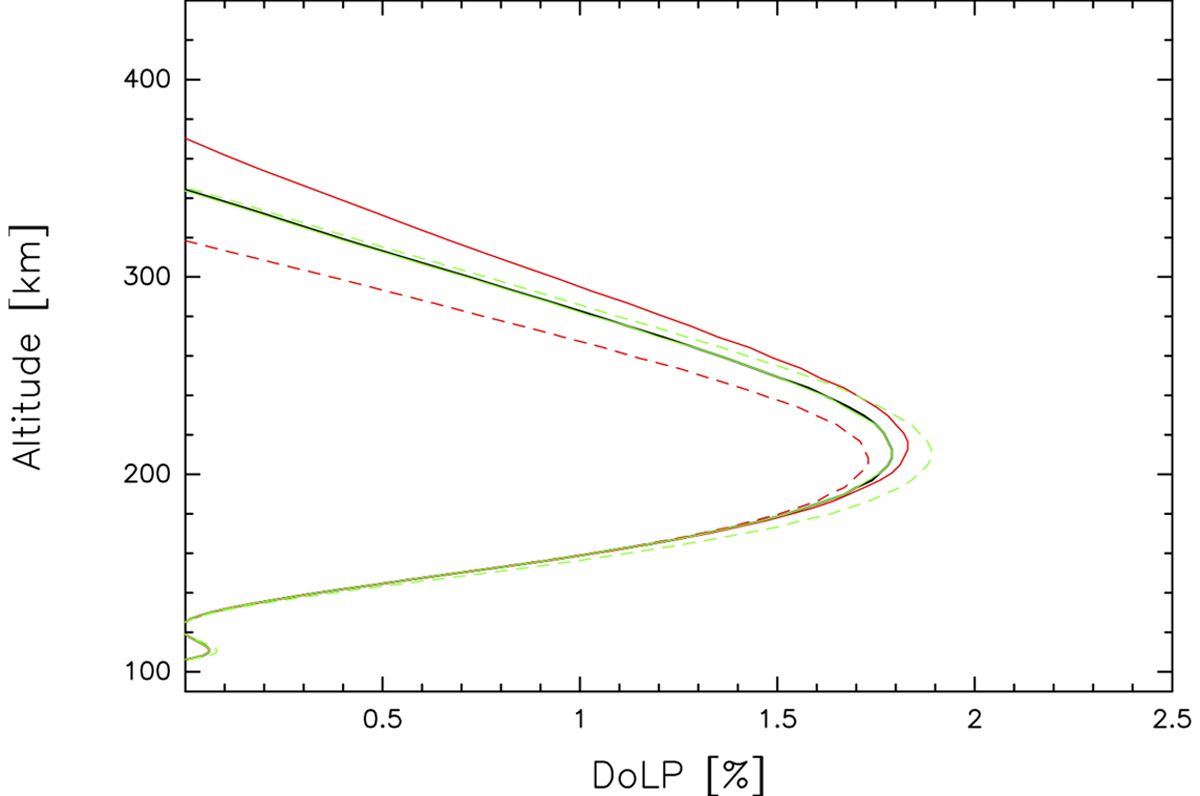
Influence of the electron temperature and density on the local DoLP. The black continuous curve is the same as in Figure 7, right panel. It is hardly visible because it is almost covered by the green continuous lines which is the estimate of the DoLP when the electron temperature is divided by a factor of 2. The green dashed line corresponds to a multiplication of 2 of the electron temperature. The red lines show the effect of dividing (continuous line) the electron density by 2 or multiplying (dashed line) it by 2.
Current usage metrics show cumulative count of Article Views (full-text article views including HTML views, PDF and ePub downloads, according to the available data) and Abstracts Views on Vision4Press platform.
Data correspond to usage on the plateform after 2015. The current usage metrics is available 48-96 hours after online publication and is updated daily on week days.
Initial download of the metrics may take a while.