Fig. 15.

Download original image
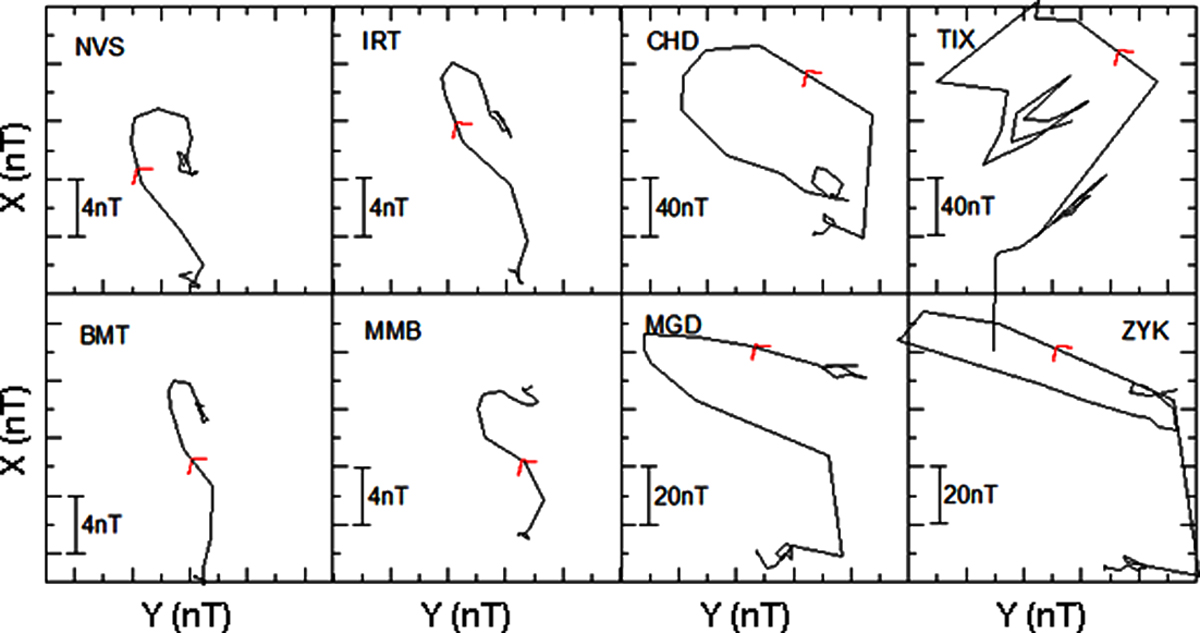
Polarization diagram representing the temporal evolution of the magnetic vector for magnetic observatories located in the meridian plane including the point of the first impact of the wavefront to the magnetopause. This polarization is the result of the synchronic variation of its components. Thirty minutes around the SI onset time, from 1800 to 1830 UT, are plotted. In every panel, X component is the ordinate and Y component is the abscissa. In the four panels on the left the polarization is linear. In the four panels on the right the polarization is counter-clockwise.
Current usage metrics show cumulative count of Article Views (full-text article views including HTML views, PDF and ePub downloads, according to the available data) and Abstracts Views on Vision4Press platform.
Data correspond to usage on the plateform after 2015. The current usage metrics is available 48-96 hours after online publication and is updated daily on week days.
Initial download of the metrics may take a while.


