Open Access
Fig. 12.
Download original image
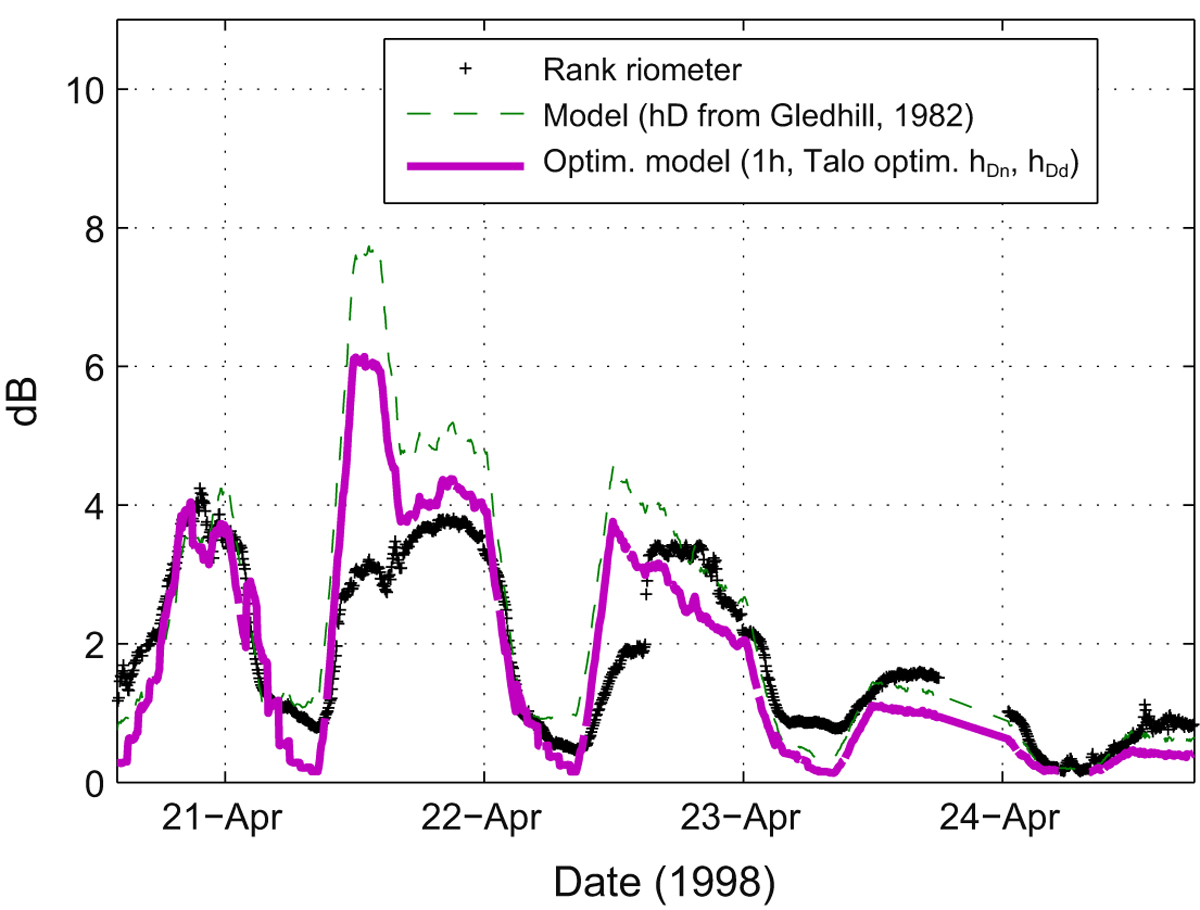
Absorption measured at Rankin Inlet riometer (“+”) with Type 2 model predictions (solid line) using the hDd and hDn (from Fig. 10) optimised for the Taloyoak riometer with τ = 6 h, updated at 1-h intervals. The dashed line represents predictions using fixed hDd and hDn from Gledhill (1986).
Current usage metrics show cumulative count of Article Views (full-text article views including HTML views, PDF and ePub downloads, according to the available data) and Abstracts Views on Vision4Press platform.
Data correspond to usage on the plateform after 2015. The current usage metrics is available 48-96 hours after online publication and is updated daily on week days.
Initial download of the metrics may take a while.