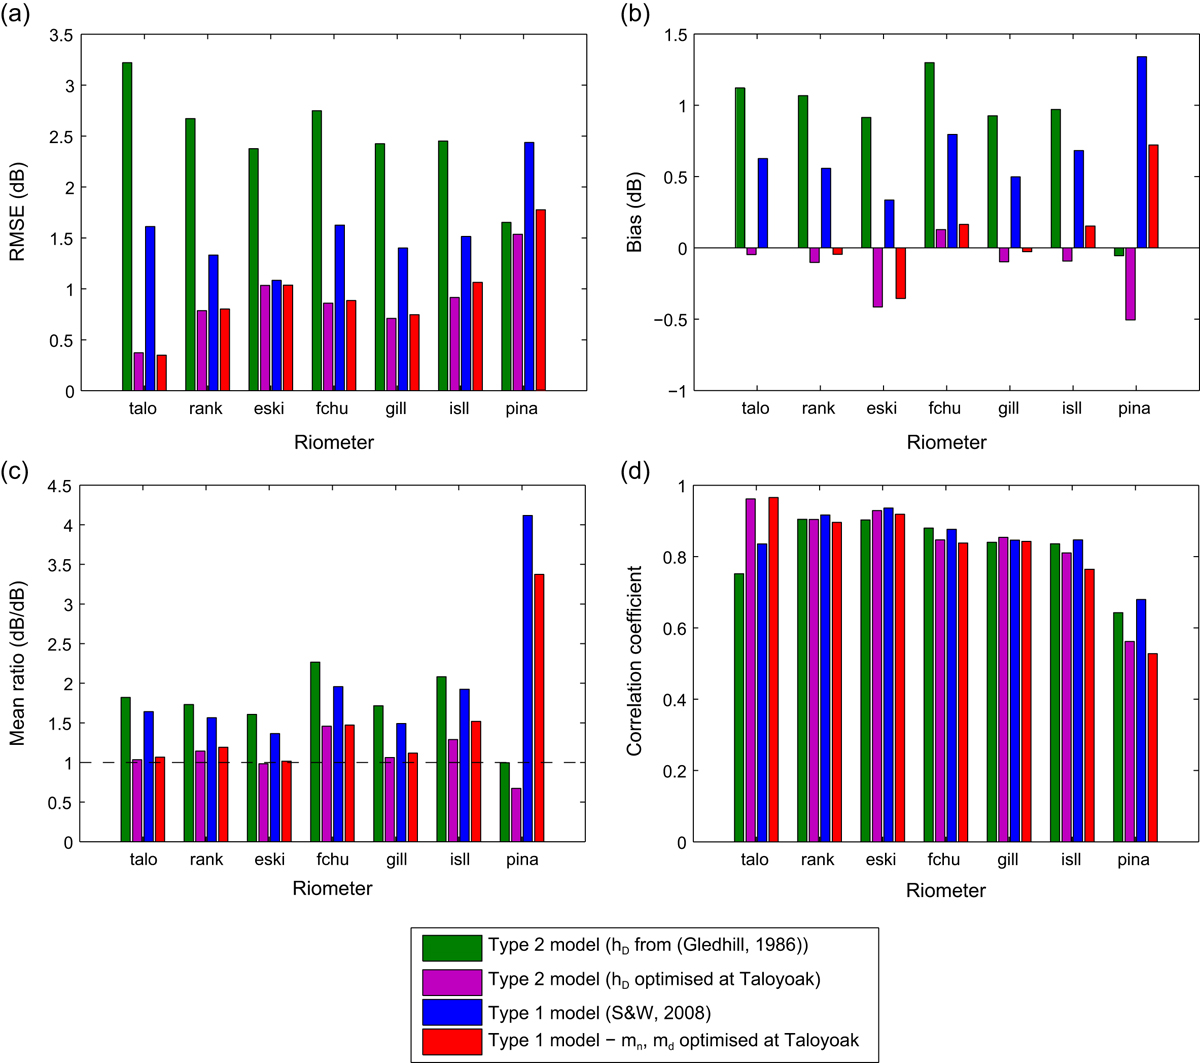
Fig. 13.
Download original image
(a) RMS errors, (b) biases, (c) mean ratios and (d) correlation coefficients for Type 2 and Type 1 PCA model predictions, with original and real-time optimised parameters, averaged over 13 SPEs of Table 8. Optimisations (second and fourth bars in each group) use the Taloyoak riometer measurements only. All models apply the Dmitriev cut-off latitude model.
Current usage metrics show cumulative count of Article Views (full-text article views including HTML views, PDF and ePub downloads, according to the available data) and Abstracts Views on Vision4Press platform.
Data correspond to usage on the plateform after 2015. The current usage metrics is available 48-96 hours after online publication and is updated daily on week days.
Initial download of the metrics may take a while.